

Answered step by step
Verified Expert Solution
Question
1 Approved Answer
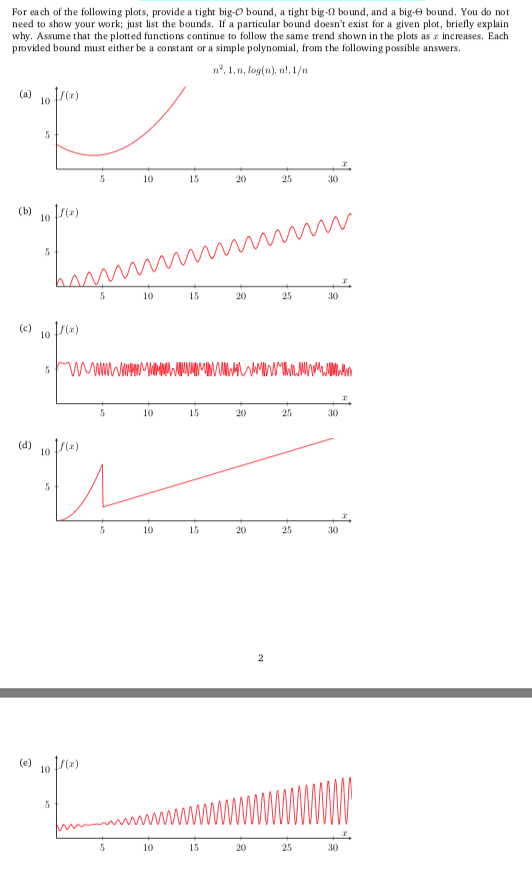
For each of the following plots, provide a tight big-O bound, a tight big-2 bound, and a big-e bound. You do not need to show
Step by Step Solution
There are 3 Steps involved in it
Step: 1

Get Instant Access to Expert-Tailored Solutions
See step-by-step solutions with expert insights and AI powered tools for academic success
Step: 2

Step: 3
Ace Your Homework with AI
Get the answers you need in no time with our AI-driven, step-by-step assistance
Get Started
Database Systems A Practical Approach To Design Implementation And Management
Authors: THOMAS CONNOLLY
6th Edition
9353438918, 978-9353438913