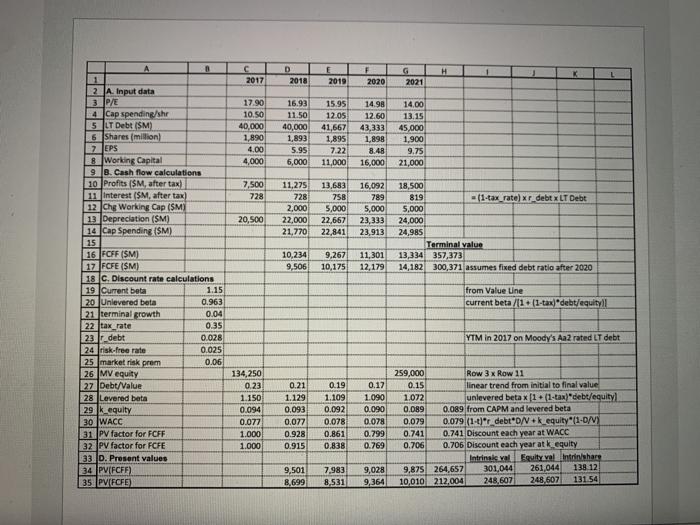
For each of the following scenarios, recalculate the intrinsic value of Chevron's shares using the free cash flow model of Spreadsheet 13.2 (included with the question). Treat each scenario independently. (LO 13-4) a. The terminal growth rate will be 3%. b. Chevron's current stock market beta (cell B21) is 1.25. c. The market risk premium (cell B27) is 6.5%. C 2017 D 2018 E 2019 F 2020 G 2021 H 1 K L 17.90 10.50 40.000 1,890 4.00 4,000 16.93 11.50 40,000 1,893 5.95 6,000 15.95 12.05 41,667 1,895 7.22 11,000 14.98 12.60 43,333 1,898 8.48 16,000 14.00 13.15 45,000 1.900 9.75 21,000 7,500 728 11,275 728 2,000 22,000 21.770 13,683 758 5,000 22,667 22,841 16,092 789 5,000 23,333 23,913 20,500 18,500 819 = (1-tax rate) xr debt x LT Debt 5,000 24,000 24,985 Terminal value 13,334 357,373 14,182 300,371 assumes fixed debt ratio after 2020 10,234 9,506 9,267 10,175 11,301 12,179 2 A. Input data 3 P/E 4 Cap spendine/shr 5 LT Debt (SM) 6 Shares (million) 7 JEPS 8 Working Capital 9 8. Cash flow calculations 10 Profits (SM, after tax) 11 Interest (SM, after tax) 12 Chg Working Cap (SM) 13 Depreciation (SM) Cap Spending (SM) 15 16 FCFF (SM) 17 FCFE (SM) 18 C. Discount rate calculations 19 Current beta 1.15 20 Unlevered beta 0.963 21 terminal growth 0.04 22 tax rate 0.35 23r debt 0.028 24 risk-free rate 0.025 25 market risk prem 0.06 26 MV equity 27. Debt/Value 28 Levered beta 29. k_equity 30 WACC 31 PV factor for FCFF 32 PV factor for FCFE 33 D. Present values 34 PVFCFE) 35 PV(FCFE) from Value Line current beta /(1+(1-tax)"debt/equityll YTM in 2017 on Moody's Aa2 rated LT debt 1.072 134,250 0.23 1.150 0.094 0.077 1.000 1.000 0.21 1.129 0.093 0.077 0.928 0.915 0.19 1.109 0.092 0.078 0.861 0.838 0.17 1.090 0.090 0.078 0.079 0.799 259,000 Row 3 x Row 11 0.15 linear trend from initial to final value unlevered betax (1 + (1-tax)"debt/equity) 0.089 0.089 from CAPM and levered beta 0.079 (1-0)" debtON + k_equity*(1-D/V 0.741 0.741 Discount each year at WACC 0.706 0.706 Discount each year at k equity Intrinek val Equity valintshare 9,875 264,657 301,044 261,044 138 12 10,010 212,004 248,607 248.607 13154 0.769 9,501 8,699 7.983 8,531 9,028 9,364 For each of the following scenarios, recalculate the intrinsic value of Chevron's shares using the free cash flow model of Spreadsheet 13.2 (included with the question). Treat each scenario independently. (LO 13-4) a. The terminal growth rate will be 3%. b. Chevron's current stock market beta (cell B21) is 1.25. c. The market risk premium (cell B27) is 6.5%. C 2017 D 2018 E 2019 F 2020 G 2021 H 1 K L 17.90 10.50 40.000 1,890 4.00 4,000 16.93 11.50 40,000 1,893 5.95 6,000 15.95 12.05 41,667 1,895 7.22 11,000 14.98 12.60 43,333 1,898 8.48 16,000 14.00 13.15 45,000 1.900 9.75 21,000 7,500 728 11,275 728 2,000 22,000 21.770 13,683 758 5,000 22,667 22,841 16,092 789 5,000 23,333 23,913 20,500 18,500 819 = (1-tax rate) xr debt x LT Debt 5,000 24,000 24,985 Terminal value 13,334 357,373 14,182 300,371 assumes fixed debt ratio after 2020 10,234 9,506 9,267 10,175 11,301 12,179 2 A. Input data 3 P/E 4 Cap spendine/shr 5 LT Debt (SM) 6 Shares (million) 7 JEPS 8 Working Capital 9 8. Cash flow calculations 10 Profits (SM, after tax) 11 Interest (SM, after tax) 12 Chg Working Cap (SM) 13 Depreciation (SM) Cap Spending (SM) 15 16 FCFF (SM) 17 FCFE (SM) 18 C. Discount rate calculations 19 Current beta 1.15 20 Unlevered beta 0.963 21 terminal growth 0.04 22 tax rate 0.35 23r debt 0.028 24 risk-free rate 0.025 25 market risk prem 0.06 26 MV equity 27. Debt/Value 28 Levered beta 29. k_equity 30 WACC 31 PV factor for FCFF 32 PV factor for FCFE 33 D. Present values 34 PVFCFE) 35 PV(FCFE) from Value Line current beta /(1+(1-tax)"debt/equityll YTM in 2017 on Moody's Aa2 rated LT debt 1.072 134,250 0.23 1.150 0.094 0.077 1.000 1.000 0.21 1.129 0.093 0.077 0.928 0.915 0.19 1.109 0.092 0.078 0.861 0.838 0.17 1.090 0.090 0.078 0.079 0.799 259,000 Row 3 x Row 11 0.15 linear trend from initial to final value unlevered betax (1 + (1-tax)"debt/equity) 0.089 0.089 from CAPM and levered beta 0.079 (1-0)" debtON + k_equity*(1-D/V 0.741 0.741 Discount each year at WACC 0.706 0.706 Discount each year at k equity Intrinek val Equity valintshare 9,875 264,657 301,044 261,044 138 12 10,010 212,004 248,607 248.607 13154 0.769 9,501 8,699 7.983 8,531 9,028 9,364


