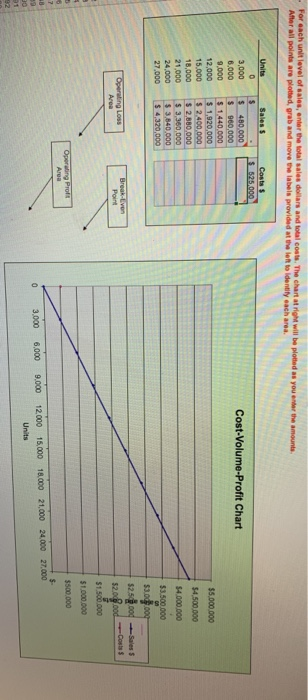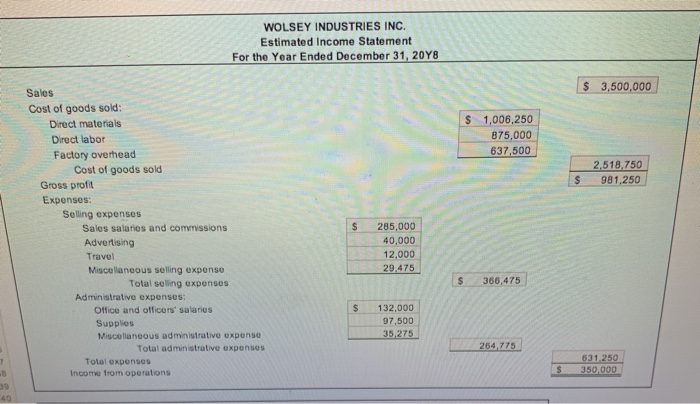
. For each unit level of sales, enter the total sales dollars and total costs. The chart at right will be plotted as you enter the amounts After all points are plothed, grab and move the labels provided at the left to identify each area Units Sales Costs S 525,000 3,000 480,000 960,000 Cost-Volume-Profit Chart 6,000 9,000 $1,440,000 12,000 $ 1,920,000 $2.400,000 $5,000,000 15.000 $4,500,000 18,000 S 2.880,000 21,000 $ 3,300,000 $ 3,840,000 $4.000.000 24,000 27,000 $ 4,320,000 $3.500,000 $3.00.000 $2,5 00 Sales $ Operating Loss Area Break-Evens Point $2.0 fond Costs $1.500.000 $1,000.000 Operating Profs Area $500,000 12,000 15,000 18.000 21,000 24.000 27.000 C 3,000 6,000 9,000 Units 1 92 WOLSEY INDUSTRIES INC. Estimated Income Statement For the Year Ended December 31, 20Y8 $ 3,500,000 Sales Cost of goods sold: 1,006,250 Direct materials 875,000 Direct labor 637,500 Factory overhead 2,518,750 Cost of goods sold 981,250 Gross profit Expenses: Selling expenses S 285,000 Sales salarios and commissions 40,000 Advertising Travel 12,000 29,475 Miscellaneous selling expense $ 366,475 Total seling expenses Administrative expenses: 132,000 Office and officers' salanies 97,500 Supplies Miscellaneous administrative expense 35.275 264,775 Total administrative expenses 631,250 Total expenses Income from operations S 350,000 40 . For each unit level of sales, enter the total sales dollars and total costs. The chart at right will be plotted as you enter the amounts After all points are plothed, grab and move the labels provided at the left to identify each area Units Sales Costs S 525,000 3,000 480,000 960,000 Cost-Volume-Profit Chart 6,000 9,000 $1,440,000 12,000 $ 1,920,000 $2.400,000 $5,000,000 15.000 $4,500,000 18,000 S 2.880,000 21,000 $ 3,300,000 $ 3,840,000 $4.000.000 24,000 27,000 $ 4,320,000 $3.500,000 $3.00.000 $2,5 00 Sales $ Operating Loss Area Break-Evens Point $2.0 fond Costs $1.500.000 $1,000.000 Operating Profs Area $500,000 12,000 15,000 18.000 21,000 24.000 27.000 C 3,000 6,000 9,000 Units 1 92 WOLSEY INDUSTRIES INC. Estimated Income Statement For the Year Ended December 31, 20Y8 $ 3,500,000 Sales Cost of goods sold: 1,006,250 Direct materials 875,000 Direct labor 637,500 Factory overhead 2,518,750 Cost of goods sold 981,250 Gross profit Expenses: Selling expenses S 285,000 Sales salarios and commissions 40,000 Advertising Travel 12,000 29,475 Miscellaneous selling expense $ 366,475 Total seling expenses Administrative expenses: 132,000 Office and officers' salanies 97,500 Supplies Miscellaneous administrative expense 35.275 264,775 Total administrative expenses 631,250 Total expenses Income from operations S 350,000 40