

Answered step by step
Verified Expert Solution
Question
1 Approved Answer
For Each year calculate the following: networking capital(NWC profit margin dividend and total payout ratios total asset turnover current and quick ratios total debt ratio
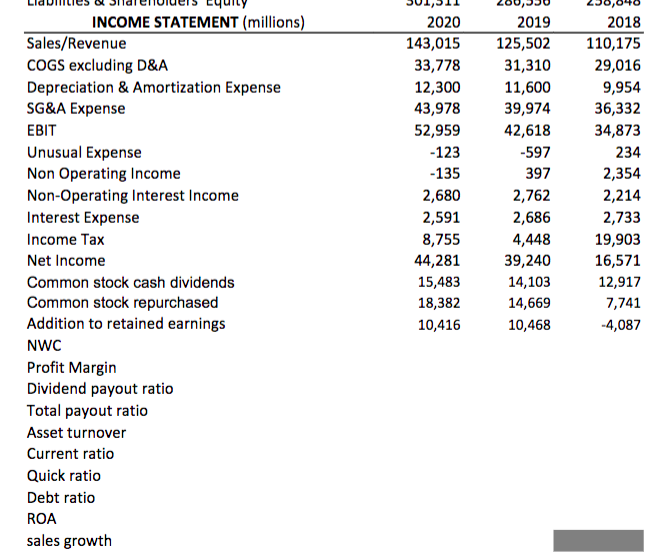
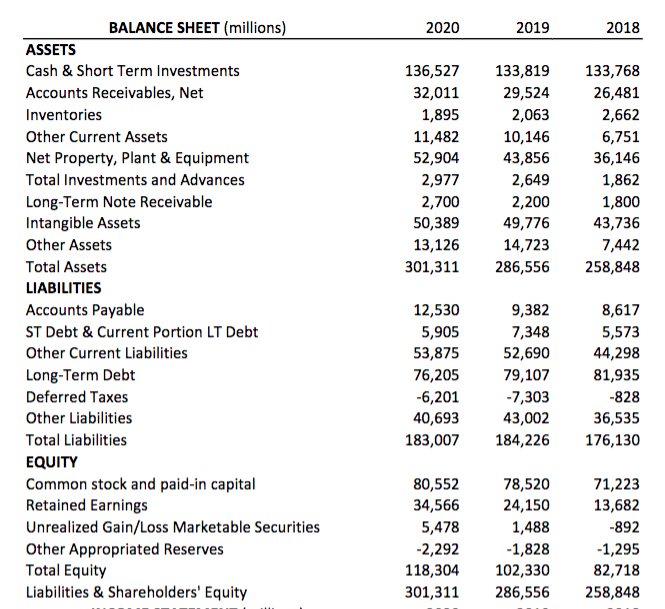
For Each year calculate the following:
networking capital(NWC
profit margin
dividend and total payout ratios
total asset turnover
current and quick ratios
total debt ratio
return-on-assets (ROA)
sales growth
INCOME STATEMENT (millions) Sales/Revenue COGS excluding D&A Depreciation & Amortization Expense SG&A Expense EBIT Unusual Expense Non Operating Income Non-Operating Interest Income Interest Expense Income Tax Net Income Common stock cash dividends Common stock repurchased Addition to retained earnings NWC Profit Margin Dividend payout ratio Total payout ratio Asset turnover Current ratio Quick ratio Debt ratio ROA sales growth 2020 143,015 33,778 12,300 43,978 52,959 -123 - 135 2,680 2,591 8,755 44,281 15,483 18,382 10,416 2019 125,502 31,310 11,600 39,974 42,618 -597 397 2,762 2,686 4,448 39,240 14,103 14,669 10,468 2018 110,175 29,016 9,954 36,332 34,873 234 2,354 2,214 2,733 19,903 16,571 12,917 7,741 -4,087 2020 2019 2018 136,527 32,011 1,895 11,482 52,904 2,977 2,700 50,389 13,126 301,311 133,819 29,524 2,063 10,146 43,856 2,649 2,200 49,776 14,723 286,556 133,768 26,481 2,662 6,751 36,146 1,862 1,800 43,736 7,442 258,848 BALANCE SHEET (millions) ASSETS Cash & Short Term Investments Accounts Receivables, Net Inventories Other Current Assets Net Property, Plant & Equipment Total Investments and Advances Long-Term Note Receivable Intangible Assets Other Assets Total Assets LIABILITIES Accounts Payable ST Debt & Current Portion LT Debt Other Current Liabilities Long-Term Debt Deferred Taxes Other Liabilities Total Liabilities EQUITY Common stock and paid-in capital Retained Earnings Unrealized Gain/Loss Marketable Securities Other Appropriated Reserves Total Equity Liabilities & Shareholders' Equity 12,530 5,905 53,875 76,205 -6,201 40,693 183,007 9,382 7,348 52,690 79,107 -7,303 43,002 184,226 8,617 5,573 44,298 81,935 -828 36,535 176,130 80,552 34,566 5,478 -2,292 118,304 301,311 78,520 24,150 1,488 -1,828 102,330 286,556 71,223 13,682 -892 -1,295 82,718 258,848 INCOME STATEMENT (millions) Sales/Revenue COGS excluding D&A Depreciation & Amortization Expense SG&A Expense EBIT Unusual Expense Non Operating Income Non-Operating Interest Income Interest Expense Income Tax Net Income Common stock cash dividends Common stock repurchased Addition to retained earnings NWC Profit Margin Dividend payout ratio Total payout ratio Asset turnover Current ratio Quick ratio Debt ratio ROA sales growth 2020 143,015 33,778 12,300 43,978 52,959 -123 - 135 2,680 2,591 8,755 44,281 15,483 18,382 10,416 2019 125,502 31,310 11,600 39,974 42,618 -597 397 2,762 2,686 4,448 39,240 14,103 14,669 10,468 2018 110,175 29,016 9,954 36,332 34,873 234 2,354 2,214 2,733 19,903 16,571 12,917 7,741 -4,087 2020 2019 2018 136,527 32,011 1,895 11,482 52,904 2,977 2,700 50,389 13,126 301,311 133,819 29,524 2,063 10,146 43,856 2,649 2,200 49,776 14,723 286,556 133,768 26,481 2,662 6,751 36,146 1,862 1,800 43,736 7,442 258,848 BALANCE SHEET (millions) ASSETS Cash & Short Term Investments Accounts Receivables, Net Inventories Other Current Assets Net Property, Plant & Equipment Total Investments and Advances Long-Term Note Receivable Intangible Assets Other Assets Total Assets LIABILITIES Accounts Payable ST Debt & Current Portion LT Debt Other Current Liabilities Long-Term Debt Deferred Taxes Other Liabilities Total Liabilities EQUITY Common stock and paid-in capital Retained Earnings Unrealized Gain/Loss Marketable Securities Other Appropriated Reserves Total Equity Liabilities & Shareholders' Equity 12,530 5,905 53,875 76,205 -6,201 40,693 183,007 9,382 7,348 52,690 79,107 -7,303 43,002 184,226 8,617 5,573 44,298 81,935 -828 36,535 176,130 80,552 34,566 5,478 -2,292 118,304 301,311 78,520 24,150 1,488 -1,828 102,330 286,556 71,223 13,682 -892 -1,295 82,718 258,848Step by Step Solution
There are 3 Steps involved in it
Step: 1

Get Instant Access to Expert-Tailored Solutions
See step-by-step solutions with expert insights and AI powered tools for academic success
Step: 2

Step: 3
Ace Your Homework with AI
Get the answers you need in no time with our AI-driven, step-by-step assistance
Get Started
Banking And Finance Managing The Moral Dimension
Authors: James Lynch
1st Edition
1855731762, 978-1855731769