Answered step by step
Verified Expert Solution
Link Copied!

Question

1 Approved Answer

For every assignment, you must include the R script that you wrote - pasted at the end of the assignment under the heading Code. For

For every assignment, you must include the R script that you wrote - pasted at the end of the assignment under the heading "Code". For full credit, code must be clearly arranged and properly commented (Type # in the comment section in R). All graphic outputs must be properly titled and labeled; take time to make plots look nice and be clear in depiction. Be clear, concise, and thorough with your answers; for many statistical questions, it is imperative that you clearly show all the steps.

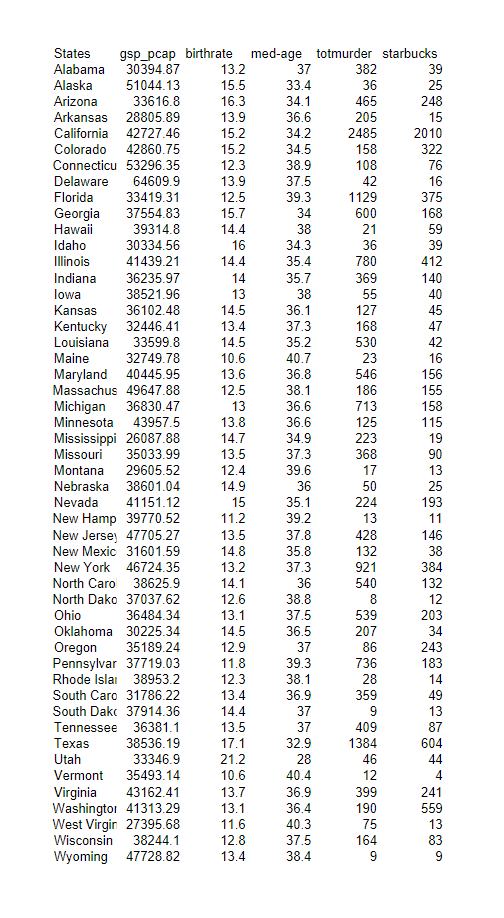
1.We have a dataset (starbucks.csv ) with a handful of stats by state.One column (starbucks) shows how many Starbucks coffee shops are in each state.We want to test if the variation in the number of Starbucks per state is accounted for by the variation in these other variables.

a.We hypothesize that a state's gross state product per capita (gsp_pcap) will explain some of the variation in the number of Starbucks.Make a scatterplot of Starbucks vs. GSP (Y vs. X).Do you think a linear regression will explain the variability?

b.Name the parametric test we should use to answer the question.List the null and alternative hypotheses in words (related to the question at hand) and in symbols (if applicable).

c.Run a regression using lm( ).Paste the results based on the results, do you reject or fail to reject the null hypothesis?State your reasons why.

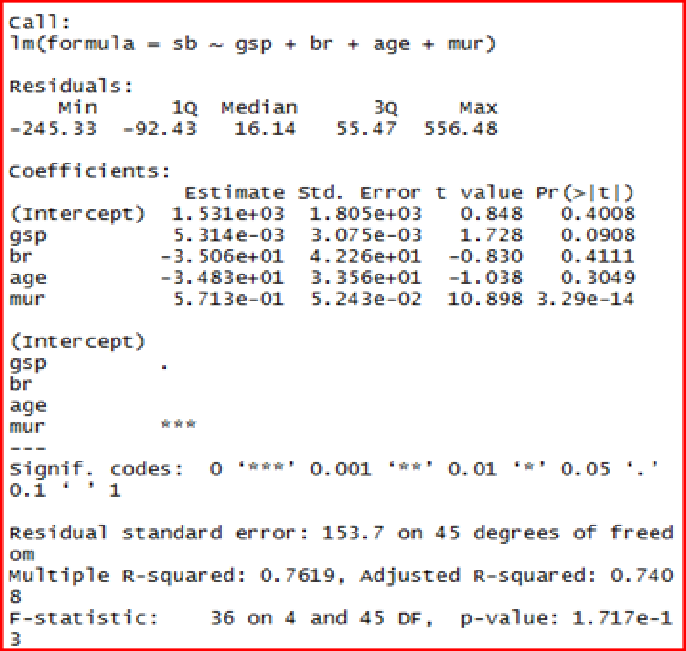
d.Below is an output from a multiple regression test that was run earlier by me [starbucks as the dependent variable, and gsp_pcap, birthrate (birth rate per 1000), med.age (median age) and totmurder (total number of murders) as independent variables]. Based on the p values, there seems to be an odd relationship between the number of Starbucks and the number of murders per state. Run a bivariate regression of starbucks ~ totmurder.Paste the results in your comment on the results. Is the strength of this relationship spurious? (Hint: think about causation and what sort of variable might co-vary with total murders)

image text in transcribedimage text in transcribed
States gsp_pcap birthrate med-age totmurder starbucks Alabama 30394.87 13.2 37 382 39 Alaska 51044.13 15.5 33.4 36 25 Arizona 33616.8 16.3 34.1 465 248 Arkansas 28805.89 13.9 36.6 205 15 California 42727.46 15.2 34.2 2485 Colorado 2010 42860.75 15.2 34.5 158 322 Connecticut53296.35 12.3 38.9 108 Delaware 76 64609.9 13.9 37.5 42 16 Florida 33419.31 12.5 39.3 1129 375 Georgia 37554.83 15.7 34 600 Hawaii 168 39314.8 14.4 38 21 Idaho 59 30334.56 16 34.3 36 39 Illinois 41439.21 14.4 35.4 780 412 Indiana 36235.97 14 35.7 369 140 lowa 38521.96 13 38 55 40 Kansas 36102.48 14.5 36.1 127 45 Kentucky 32446.41 13.4 37.3 168 47 Louisiana 33599.8 14.5 35.2 530 Maine 42 32749.78 10.6 40.7 23 16 Maryland 40445.95 13.6 36.8 546 156 Massachus 12.5 38.1 186 Michigan 155 36830.47 13 36.6 713 158 Minnesota 43957.5 13.8 36.6 125 115 Mississippi 26087.88 14.7 34.9 223 Missouri 19 35033.99 13.5 37.3 368 90 Montana 29605.52 12.4 39.6 17 13 Nebraska 38601.04 14.9 36 50 25 Nevada 41151.12 15 35.1 224 193 New Hamp 39770.52 11.2 39.2 13 11 New Jersey 47705.27 13.5 37.8 428 146 New Mexico1.59 14.8 35.8 132 New York 46724.35 38 13.2 37.3 921 384 North Caro 38625.9 14.1 36 540 North Dako 132 12.6 38.8 8 Ohio 12 36484.34 13.1 37.5 539 203 Oklahoma 30225.34 14.5 36.5 207 34 Oregon 35189.24 12.9 37 86 Pennsylvan 243 11.8 39.3 736 183 Rhode Island38953.2 12.3 38.1 28 14 South Caro 31786.22 13.4 36.9 359 49 South Dakc 37914.36 14.4 37 9 13 Tennessee 36381.1 13.5 37 409 87 Texas 38536.19 17.1 32.9 1384 Utah 604 33346.9 21.2 28 46 Vermont 44 35493.14 10.6 40.4 12 4 Virginia 43162.41 13.7 36.9 399 241 Washington 41313.29 13.1 36.4 190 559 West Virgin 27395.68 11.6 40.3 75 13 Wisconsin 38244.1 12.8 37.5 164 83 Wyoming 47728.82 13.4 38.4 9 9Call : Im(formula = sb - gsp + br + age + mur) Residuals : Min 10 Median Max -245.33 -92. 43 16.14 55.47 556.48 Coefficients: Estimate Std. Error t value Pr (alt|) (Intercept) 1. 5310+03 1. 805e+03 0. 848 0. 4008 gsp 5. 314e-03 3.075e-03 1. 728 0. 0908 br -3. 506e+01 4.226e+01 -0. 830 0. 4111 age -3. 483e+01 3.356e+01 -1. 038 0. 3049 mur 5. 713e-01 5. 243e-02 10.898 3. 290-14 (Intercept) gsp br age mur Signif. codes: 0 '#' 0.001 "##' 0. 01 "#' 0.05 ." 1 Residual standard error: 153.7 on 45 degrees of freed om Multiple R-squared: 0. 7619, Adjusted R-squared: 0.740 F-statistic: 36 on 4 and 45 DF, p-value: 1. 717e-1 3

Step by Step Solution

There are 3 Steps involved in it

Step: 1

blur-text-image

Get Instant Access to Expert-Tailored Solutions

See step-by-step solutions with expert insights and AI powered tools for academic success

Step: 2

blur-text-image

Step: 3

blur-text-image

Ace Your Homework with AI

Get the answers you need in no time with our AI-driven, step-by-step assistance

Get Started

Recommended Textbook for

Advanced Engineering Mathematics

Authors: ERWIN KREYSZIG

9th Edition

0471488852, 978-0471488859

More Books

Students also viewed these Mathematics questions