Answered step by step
Verified Expert Solution
Question
1 Approved Answer
For example, a periodic square wave can be written as a sum of cosines as shown here. In this problem you will create a plot


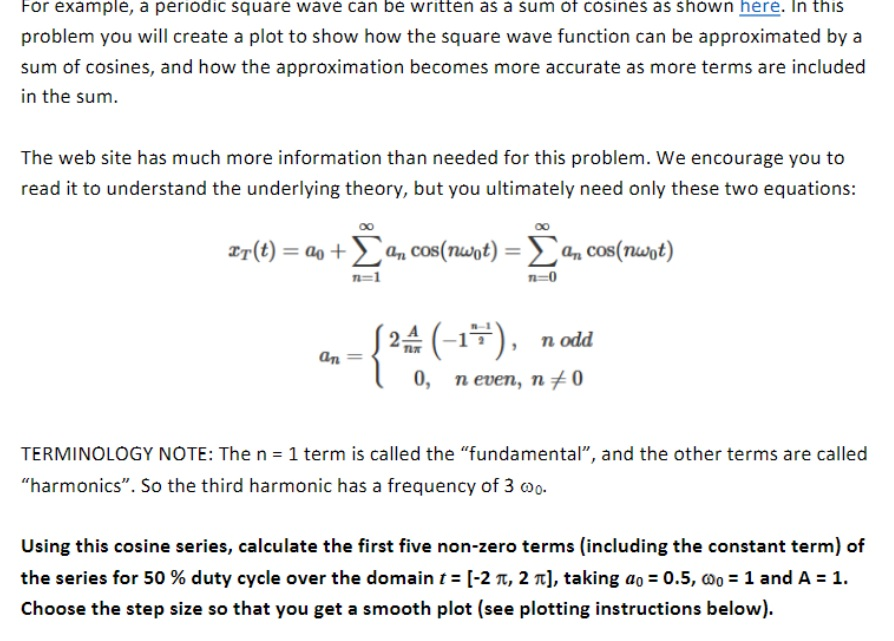
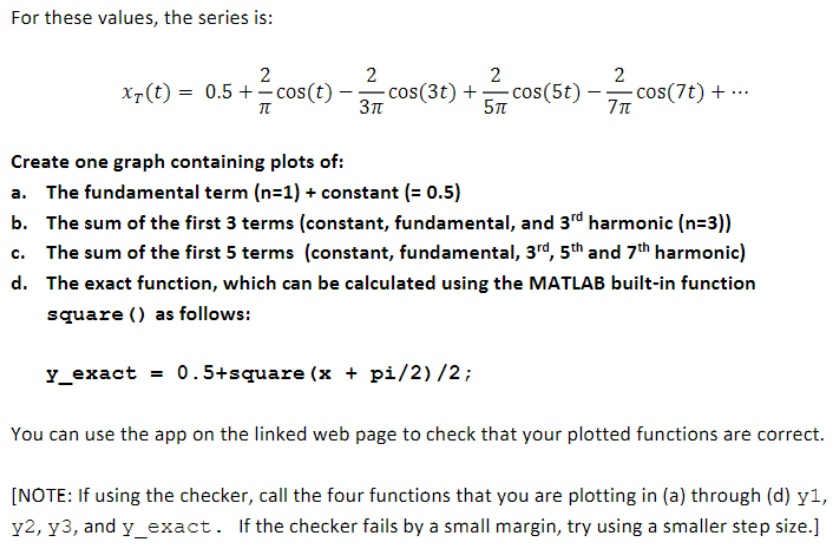
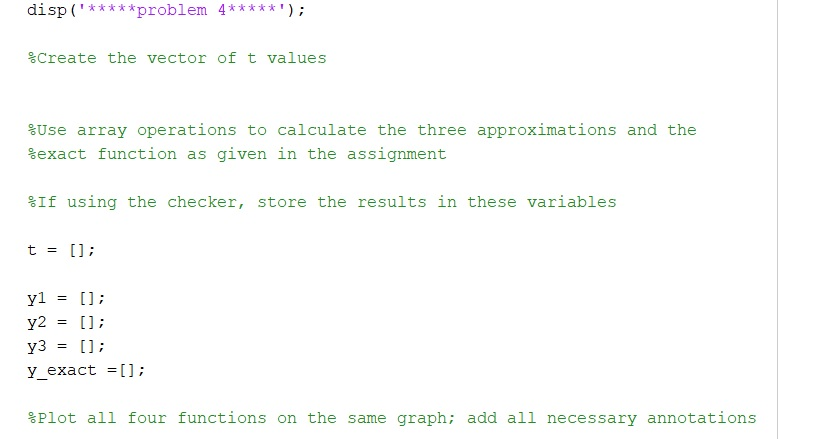
For example, a periodic square wave can be written as a sum of cosines as shown here. In this problem you will create a plot to show how the square wave function can be approximated by a sum of cosines, and how the approximation becomes more accurate as more terms are included in the sum. The web site has much more information than needed for this problem. We encourage you to read it to understand the underlying theory, but you ultimately need only these two equations: Er(e) = + a, cos(rust) = a, cosmust) on = 24 (-17), nodd 10, neven, n +0 TERMINOLOGY NOTE: The n = 1 term is called the "fundamental", and the other terms are called "harmonics. So the third harmonic has a frequency of 3 000. Using this cosine series, calculate the first five non-zero terms (including the constant term) of the series for 50 % duty cycle over the domain t = [-2 T, 2 1], taking ao = 0.5, 0 = 1 and A = 1. Choose the step size so that you get a smooth plot (see plotting instructions below). For these values, the series is: X7(0) = 0.5 +.cos(o) 3. cos(30) + cos (50) = cos(7) +... Create one graph containing plots of: a. The fundamental term (n=1) + constant (= 0.5) b. The sum of the first 3 terms (constant, fundamental, and 3rd harmonic (n=3)) c. The sum of the first 5 terms (constant, fundamental, 3rd, 5th and 7th harmonic) d. The exact function, which can be calculated using the MATLAB built-in function square () as follows: Y_exact = 0.5+square (x + pi/2)/2; You can use the app on the linked web page to check that your plotted functions are correct. [NOTE: If using the checker, call the four functions that you are plotting in (a) through (d) yl, y2, y3, and y_exact. If the checker fails by a small margin, try using a smaller step size.] disp ("*****problem 4*****'); %Create the vector of t values &Use array operations to calculate the three approximations and the %exact function as given in the assignment If using the checker, store the results in these variables t = []; yl = []; y2 = []; y3 = []; y_exact = []; Plot all four functions on the same graph; add all necessary annotations
Step by Step Solution
There are 3 Steps involved in it
Step: 1

Get Instant Access to Expert-Tailored Solutions
See step-by-step solutions with expert insights and AI powered tools for academic success
Step: 2

Step: 3

Ace Your Homework with AI
Get the answers you need in no time with our AI-driven, step-by-step assistance
Get Started


