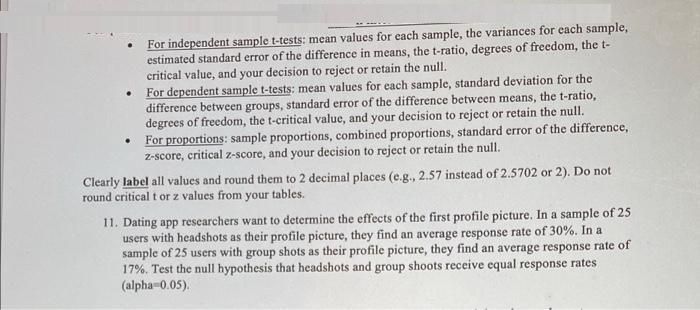
For independent sample t-tests: mean values for each sample, the variances for each sample, estimated standard error of the difference in means, the t-ratio,

For independent sample t-tests: mean values for each sample, the variances for each sample, estimated standard error of the difference in means, the t-ratio, degrees of freedom, the t- critical value, and your decision to reject or retain the null. For dependent sample t-tests: mean values for each sample, standard deviation for the difference between groups, standard error of the difference between means, the t-ratio, degrees of freedom, the t-critical value, and your decision to reject or retain the null. For proportions: sample proportions, combined proportions, standard error of the difference, z-score, critical z-score, and your decision to reject or retain the null. Clearly label all values and round them to 2 decimal places (e.g., 2.57 instead of 2.5702 or 2). Do not round critical t or z values from your tables. 11. Dating app researchers want to determine the effects of the first profile picture. In a sample of 25 users with headshots as their profile picture, they find an average response rate of 30%. In a sample of 25 users with group shots as their profile picture, they find an average response rate of 17%. Test the null hypothesis that headshots and group shoots receive equal response rates (alpha-0.05).
Step by Step Solution
3.52 Rating (155 Votes )
There are 3 Steps involved in it
Step: 1
Here we have n 100 P 076 n 100 P 064 Hyp...
See step-by-step solutions with expert insights and AI powered tools for academic success
Step: 2

Step: 3

Ace Your Homework with AI
Get the answers you need in no time with our AI-driven, step-by-step assistance
Get Started


