

Answered step by step
Verified Expert Solution
Question
1 Approved Answer
FOR KIA CORPORATION . From year 2018-2020 Balance sheet and Income sheet are located in yahoo finance Industry Average Ratio Formula Calculation Ratio Comment Liquidity
FOR KIA CORPORATION . From year 2018-2020 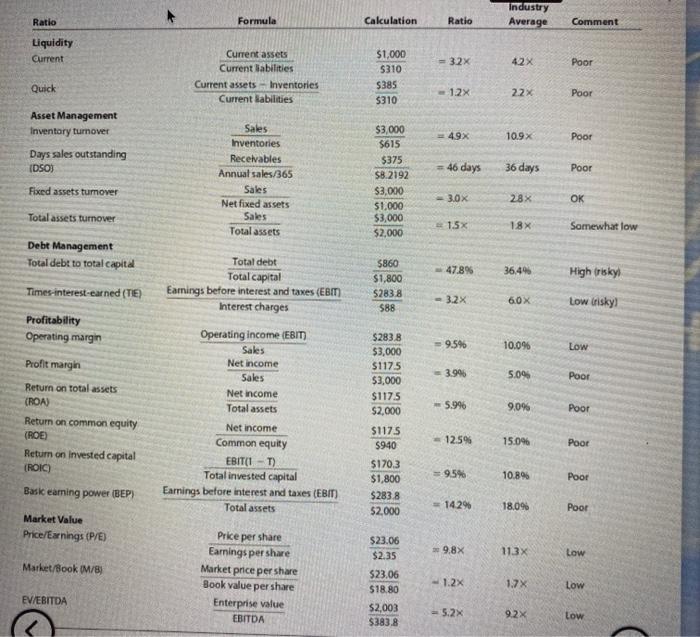
Balance sheet and Income sheet are located in yahoo finance
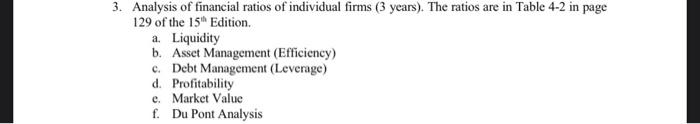
Industry Average Ratio Formula Calculation Ratio Comment Liquidity Current $1,000 $310 32x 42X Poor Current assets Current liabilities Current assets Inventories Current abilities Quick $385 1.2x 22x Poor $310 Asset Management Inventory turnover Days sales outstanding (DSO) 49x 10.9 Poor "" = 46 days 36 days Poor Sales Inventories Receivables Annual sales/365 Sales Net fixed assets Sales Total assets $3,000 $615 $375 $8.2192 $3,000 $1.000 $3,000 $2,000 Fixed assets turnover - 3.0x 28X OK Total assets turnover 1.5% 18X Somewhat low Debt Management Total debt to total capital 47.896 36.4% High risky Times-interest-earned (TE) 5860 $1,800 $2838 $88 -3.2x 60X Low risky Profitability Operating margin = 9.5% 10.0% Low Profit margin -3.996 5.09 Poor Total debt Total capital Earings before interest and taxes (EBIT) Interest charges Operating income (EBIT) Sales Net income Sales Net income Total assets Net income Common equity EBIT(1 -T) Total invested capital Earnings before interest and taxes (EBIT) Total assets 5.99 9.0% Return on total assets (ROA) Return on common equity (ROE) Return on invested capital (ROIC) Bask earning power (BEP) Poor $283.8 $3,000 $1175 $3,000 $1175 $2,000 $1175 $940 $170.3 $1,800 $283.8 52.000 12.5% 15.0% Poor - 9.5% 10.89 Poor 1429 18,0% Poor Market Value Price/Earnings (P/E) 9,8X 113x Low Market/Book (M/8) Prke per share Earnings per share Market price per share Book value per share Enterprise value EBITDA $23.06 $2.35 $23.06 $18.80 -1.2x 1.7% Low EV/EBITDA $2,003 $383.8 5.2% 9.2% Low 3. Analysis of financial ratios of individual firms (3 years). The ratios are in Table 4-2 in page 129 of the 15 Edition. a. Liquidity b. Asset Management (Efficiency) c. Debt Management (Leverage) d. Profitability e. Market Value f. Du Pont Analysis Industry Average Ratio Formula Calculation Ratio Comment Liquidity Current $1,000 $310 32x 42X Poor Current assets Current liabilities Current assets Inventories Current abilities Quick $385 1.2x 22x Poor $310 Asset Management Inventory turnover Days sales outstanding (DSO) 49x 10.9 Poor "" = 46 days 36 days Poor Sales Inventories Receivables Annual sales/365 Sales Net fixed assets Sales Total assets $3,000 $615 $375 $8.2192 $3,000 $1.000 $3,000 $2,000 Fixed assets turnover - 3.0x 28X OK Total assets turnover 1.5% 18X Somewhat low Debt Management Total debt to total capital 47.896 36.4% High risky Times-interest-earned (TE) 5860 $1,800 $2838 $88 -3.2x 60X Low risky Profitability Operating margin = 9.5% 10.0% Low Profit margin -3.996 5.09 Poor Total debt Total capital Earings before interest and taxes (EBIT) Interest charges Operating income (EBIT) Sales Net income Sales Net income Total assets Net income Common equity EBIT(1 -T) Total invested capital Earnings before interest and taxes (EBIT) Total assets 5.99 9.0% Return on total assets (ROA) Return on common equity (ROE) Return on invested capital (ROIC) Bask earning power (BEP) Poor $283.8 $3,000 $1175 $3,000 $1175 $2,000 $1175 $940 $170.3 $1,800 $283.8 52.000 12.5% 15.0% Poor - 9.5% 10.89 Poor 1429 18,0% Poor Market Value Price/Earnings (P/E) 9,8X 113x Low Market/Book (M/8) Prke per share Earnings per share Market price per share Book value per share Enterprise value EBITDA $23.06 $2.35 $23.06 $18.80 -1.2x 1.7% Low EV/EBITDA $2,003 $383.8 5.2% 9.2% Low 3. Analysis of financial ratios of individual firms (3 years). The ratios are in Table 4-2 in page 129 of the 15 Edition. a. Liquidity b. Asset Management (Efficiency) c. Debt Management (Leverage) d. Profitability e. Market Value f. Du Pont Analysis Step by Step Solution
There are 3 Steps involved in it
Step: 1

Get Instant Access to Expert-Tailored Solutions
See step-by-step solutions with expert insights and AI powered tools for academic success
Step: 2

Step: 3
Ace Your Homework with AI
Get the answers you need in no time with our AI-driven, step-by-step assistance
Get Started
School Finance Elections
Authors: Don E. Lifto, Bradford J. Senden, Daniel A. Domenech
2nd Edition
1607091488, 978-1607091486