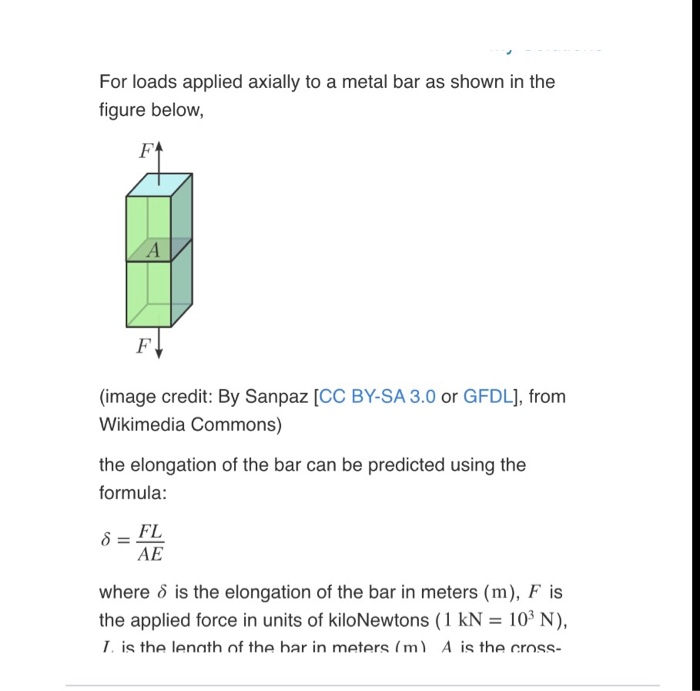
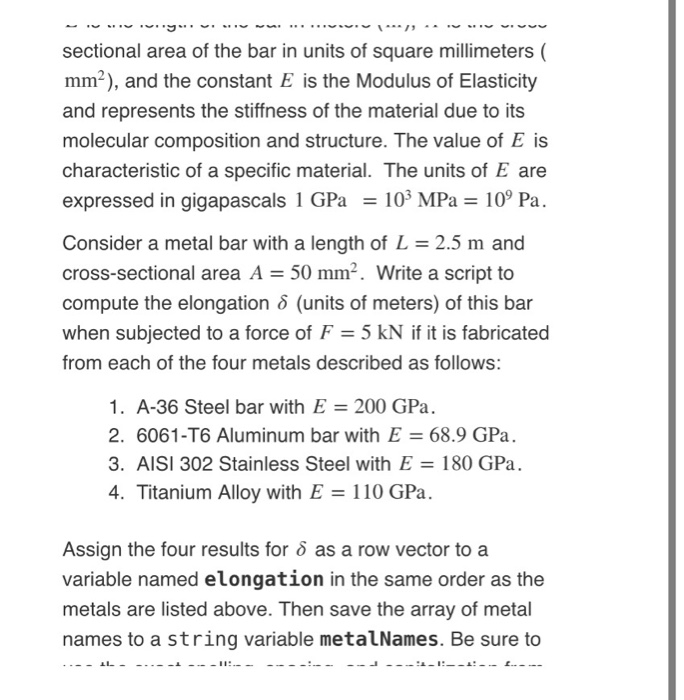
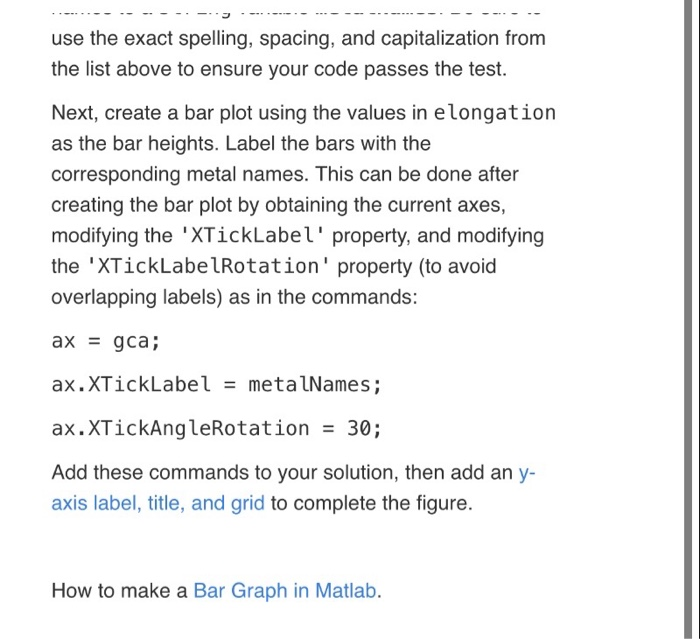
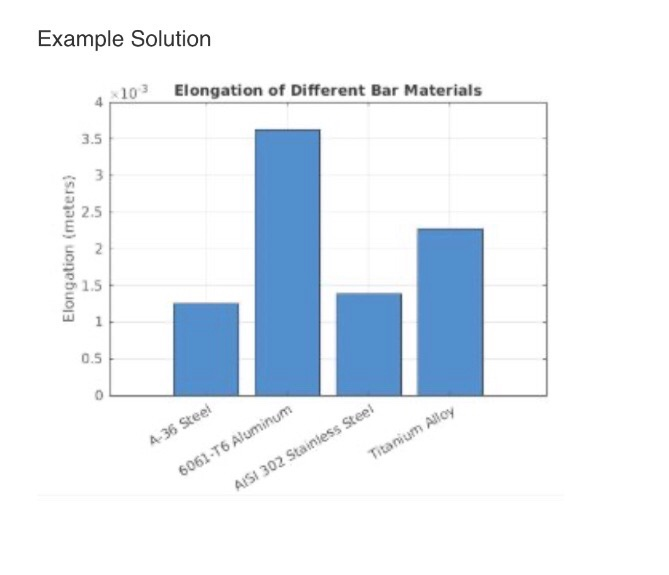
For loads applied axially to a metal bar as shown in the figure below, (image credit: By Sanpaz [CC BY-SA 3.0 or GFDL), from Wikimedia Commons) the elongation of the bar can be predicted using the formula: 8 = FL AE where 8 is the elongation of the bar in meters (m), F is the applied force in units of kiloNewtons (1 kN = 103 N), I is the length of the bar in meters (m) A is the cross- sectional area of the bar in units of square millimeters ( mm), and the constant E is the Modulus of Elasticity and represents the stiffness of the material due to its molecular composition and structure. The value of E is characteristic of a specific material. The units of E are expressed in gigapascals 1 GPa = 103 MPa = 109 Pa. Consider a metal bar with a length of L = 2.5 m and cross-sectional area A = 50 mm. Write a script to compute the elongation 8 (units of meters) of this bar when subjected to a force of F = 5 kN if it is fabricated from each of the four metals described as follows: 1. A-36 Steel bar with E = 200 GPa. 2. 6061-T6 Aluminum bar with E = 68.9 GPa. 3. AISI 302 Stainless Steel with E = 180 GPa. 4. Titanium Alloy with E = 110 GPa. Assign the four results for d as a row vector to a variable named elongation in the same order as the metals are listed above. Then save the array of metal names to a string variable metalNames. Be sure to ..-. II.- -..--I ---11:- - ------- -- ---- - -- -- - - -- - - -- ----- - - - - - use the exact spelling, spacing, and capitalization from the list above to ensure your code passes the test. Next, create a bar plot using the values in elongation as the bar heights. Label the bars with the corresponding metal names. This can be done after creating the bar plot by obtaining the current axes, modifying the 'XTickLabel' property, and modifying the 'XTickLabelRotation' property (to avoid overlapping labels) as in the commands: ax = gca; ax.XTickLabel = metalNames; ax. XTickAngleRotation = 30; Add these commands to your solution, then add an y- axis label, title, and grid to complete the figure. How to make a Bar Graph in Matlab. Example Solution 103 Elongation of Different Bar Materials Elongation (meters) A-36 Steel Titanium Alloy 6061-T6 Aluminum AISI 302 Stainless Steel Save C Reset DMATLAB Documentation Run Script Assessment: Submit Is the string array assigned to metalNames correct
