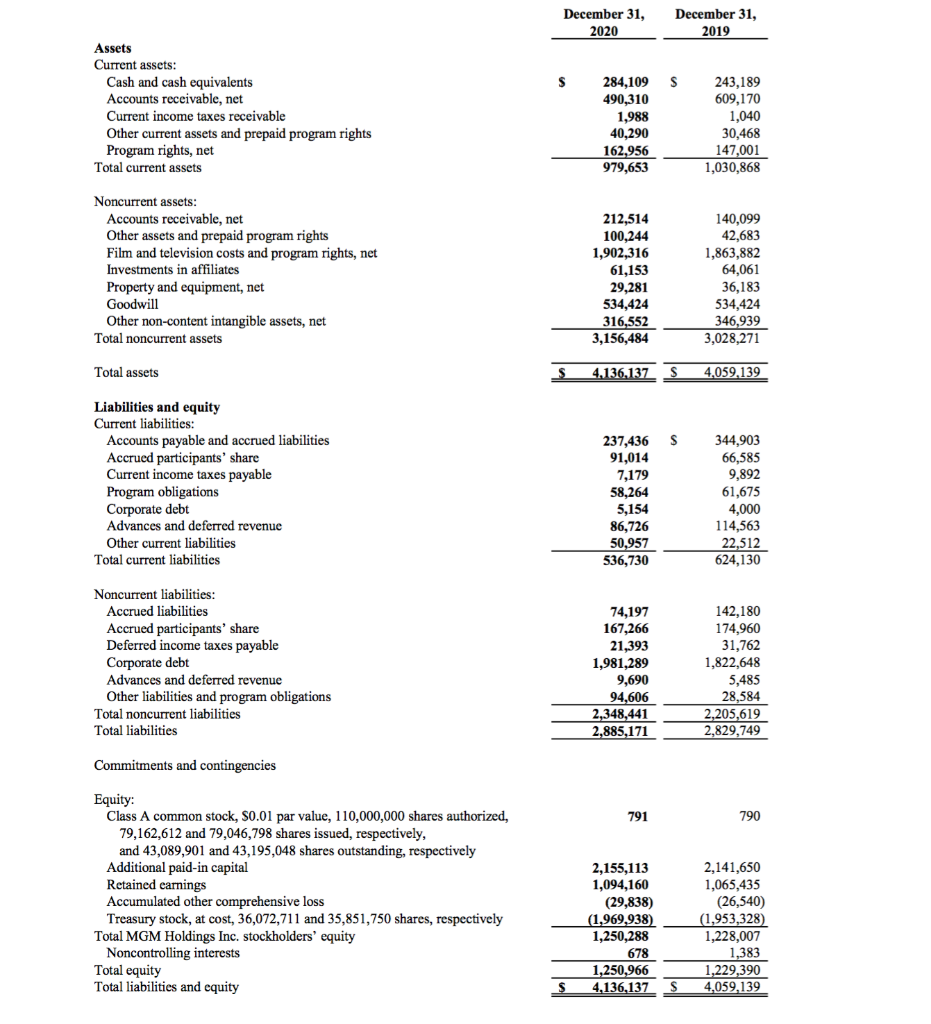
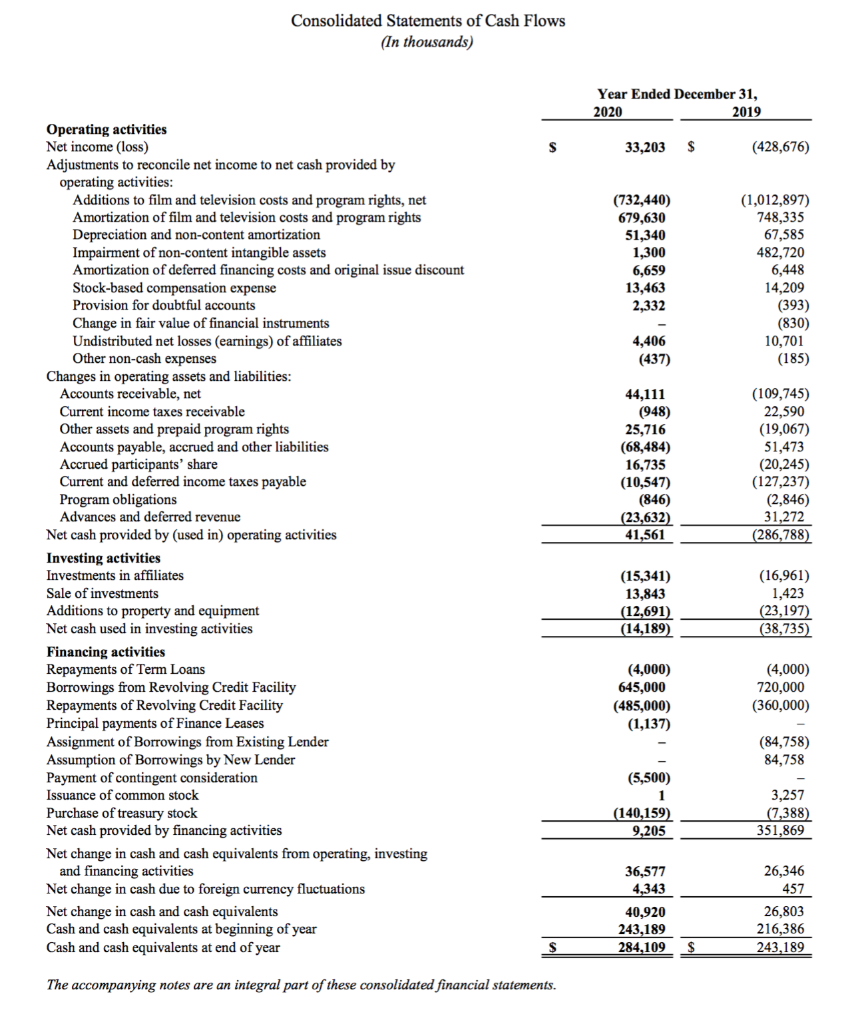
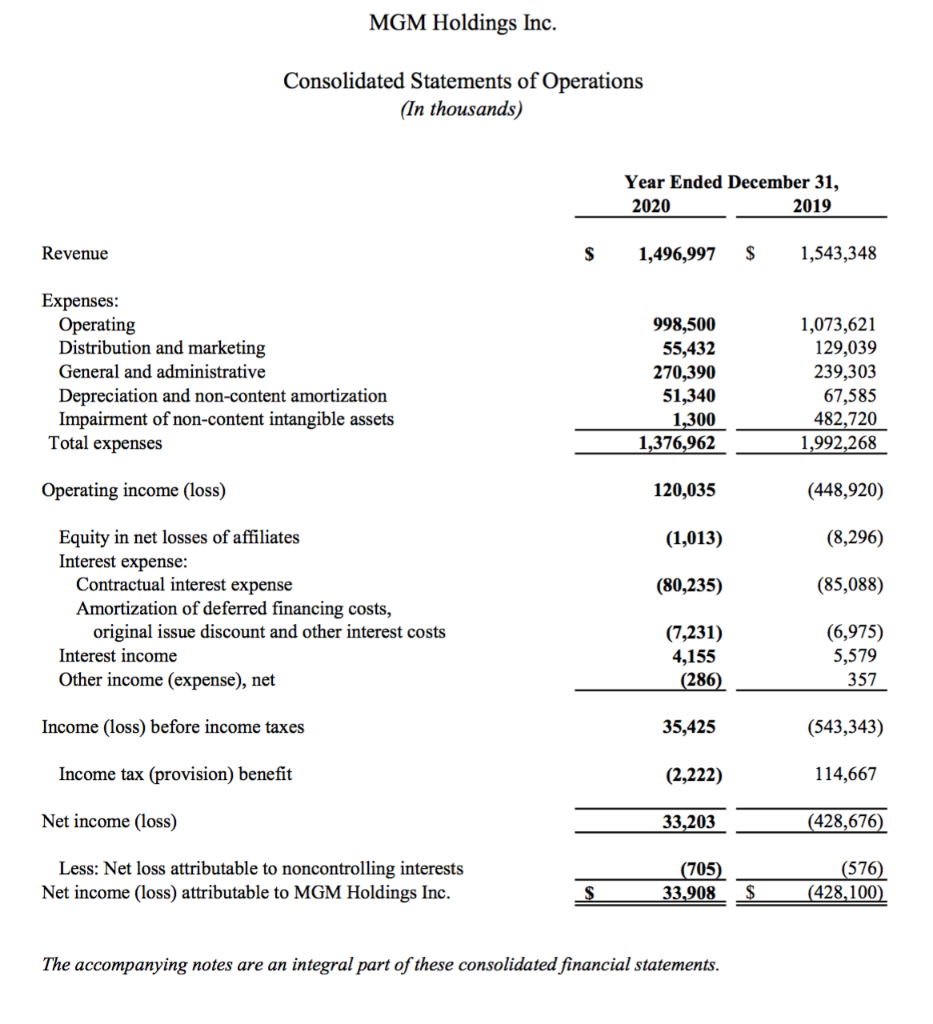
For MGM Studios, assume an effective tax rate of 23%.
Calculate the following: a. Interest and Cash Coverage Ratios b. Quick Ratio c. Asset Turnover d. operating profit margin e. Return on assets.
Furthermore, with share price of $84.50;
Calculate: -Book to Market Ratio.
- Altman's z-score
- Enterprise Value.


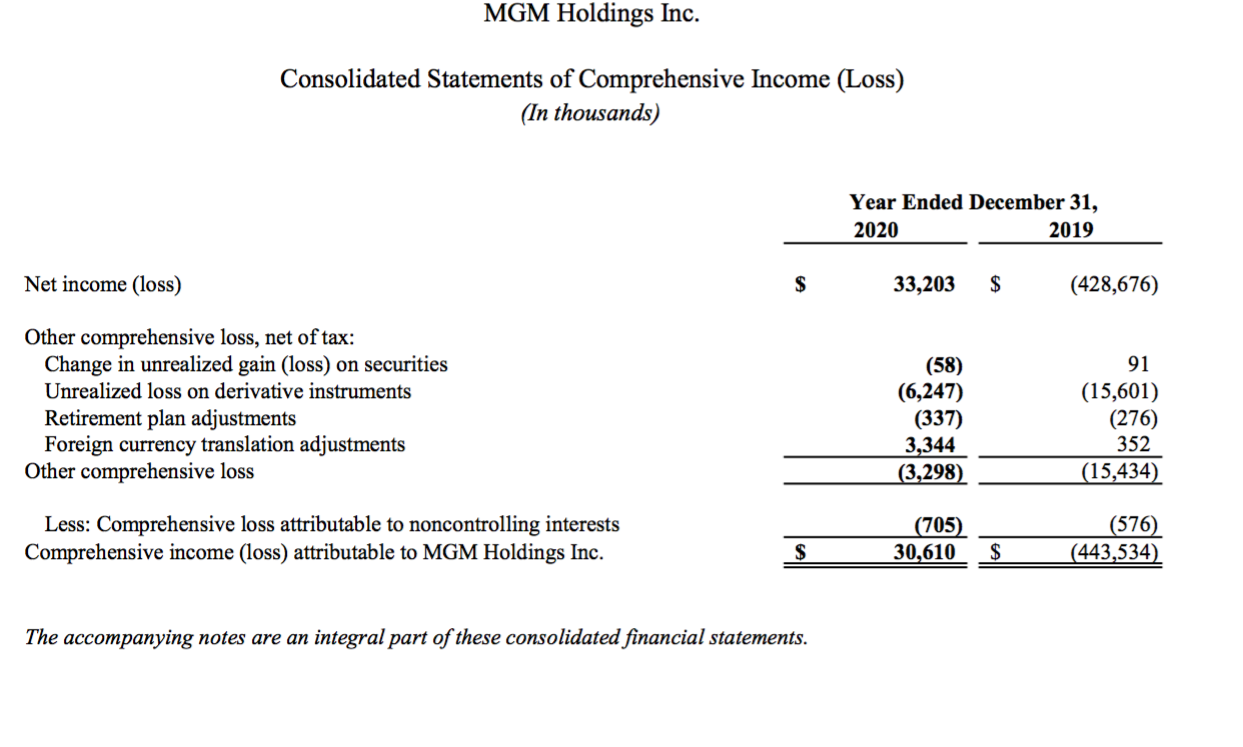
December 31, 2020 December 31, 2019 S S Assets Current assets: Cash and cash equivalents Accounts receivable, net Current income taxes receivable Other current assets and prepaid program rights Program rights, net Total current assets 284,109 490,310 1,988 40,290 162,956 979,653 243,189 609,170 1,040 30,468 147,001 1,030,868 Noncurrent assets: Accounts receivable, net Other assets and prepaid program rights Film and television costs and program rights, net Investments in affiliates Property and equipment, net Goodwill Other non-content intangible assets, net Total noncurrent assets 212,514 100,244 1,902,316 61,153 29,281 534,424 316,552 3,156,484 140,099 42,683 1,863,882 64,061 36,183 534,424 346,939 3,028,271 Total assets S 4.136,137 4,059,139 $ Liabilities and equity Current liabilities: Accounts payable and accrued liabilities Accrued participants' share Current income taxes payable Program obligations Corporate debt Advances and deferred revenue Other current liabilities Total current liabilities 344,903 66,585 9,892 61.675 237,436 91,014 7,179 58,264 5,154 86,726 50,957 536,730 4,000 114,563 22,512 624,130 74,197 167,266 21,393 Noncurrent liabilities: Accrued liabilities Accrued participants' share Deferred income taxes payable Corporate debt Advances and deferred revenue Other liabilities and program obligations Total noncurrent liabilities Total liabilities 1,981,289 9,690 94.606 2,348,441 2,885,171 142,180 174,960 31,762 1,822,648 5,485 28,584 2,205,619 2,829,749 Commitments and contingencies 791 790 Equity Class A common stock, S0.01 par value, 110,000,000 shares authorized, 79,162,612 and 79,046,798 shares issued, respectively, and 43,089,901 and 43,195,048 shares outstanding, respectively Additional paid-in capital Retained earnings Accumulated other comprehensive loss Treasury stock, at cost, 36,072,711 and 35,851,750 shares, respectively Total MGM Holdings Inc. stockholders' equity Noncontrolling interests Total equity Total liabilities and equity 2,155,113 1,094,160 (29,838) (1,969,938) 1,250,288 678 1,250,966 4,136,137 2,141,650 1,065,435 (26,540 (1,953,328) 1,228,007 1,383 1,229,390 4,059,139 S Consolidated Statements of Cash Flows (In thousands) Year Ended December 31, 2020 2019 S 33,203 $ (428,676) (732,440) 679,630 51,340 1,300 6,659 13,463 2,332 (1,012,897) 748,335 67,585 482,720 6,448 14,209 (393) (830) 10,701 (185) 4,406 (437) Operating activities Net income (loss) Adjustments to reconcile net income to net cash provided by operating activities: Additions to film and television costs and program rights, net Amortization of film and television costs and program rights Depreciation and non-content amortization Impairment of non-content intangible assets Amortization of deferred financing costs and original issue discount Stock-based compensation expense Provision for doubtful accounts Change in fair value of financial instruments Undistributed net losses (earnings) of affiliates Other non-cash expenses Changes in operating assets and liabilities: Accounts receivable, net Current income taxes receivable Other assets and prepaid program rights Accounts payable, accrued and other liabilities Accrued participants' share Current and deferred income taxes payable Program obligations Advances and deferred revenue Net cash provided by (used in) operating activities Investing activities Investments in affiliates Sale of investments Additions to property and equipment Net cash used in investing activities Financing activities Repayments of Term Loans Borrowings from Revolving Credit Facility Repayments of Revolving Credit Facility Principal payments of Finance Leases Assignment of Borrowings from Existing Lender Assumption of Borrowings by New Lender Payment of contingent consideration Issuance of common stock Purchase of treasury stock Net cash provided by financing activities Net change in cash and cash equivalents from operating, investing and financing activities Net change in cash due to foreign currency fluctuations Net change in cash and cash equivalents Cash and cash equivalents at beginning of year Cash and cash equivalents at end of year 44,111 (948) 25,716 (68,484) 16,735 (10,547) (846) (23,632) 41,561 (109,745) 22,590 (19,067) 51,473 (20,245) (127,237) (2,846) 31,272 (286,788) (15,341) 13,843 (12,691) (14,189) (16,961) 1,423 (23,197) (38,735) (4,000) 645,000 (485,000) (1,137) (4,000) 720,000 (360,000) (84,758) 84,758 (5,500) 1 (140,159) 9,205 3,257 (7,388) 351,869 36,577 4,343 40,920 243,189 284,109 26,346 457 26,803 216,386 243,189 $ S The accompanying notes are an integral part of these consolidated financial statements. MGM Holdings Inc. Consolidated Statements of Operations (In thousands) Year Ended December 31, 2020 2019 Revenue $ 1,496,997 $ 1,543,348 Expenses: Operating Distribution and marketing General and administrative Depreciation and non-content amortization Impairment of non-content intangible assets Total expenses 998,500 55,432 270,390 51,340 1,300 1,376,962 1,073,621 129,039 239,303 67,585 482,720 1,992,268 Operating income (loss) 120,035 (448,920) (1,013) (8,296) (80,235) (85,088) Equity in net losses of affiliates Interest expense: Contractual interest expense Amortization of deferred financing costs, original issue discount and other interest costs Interest income Other income (expense), net (7,231) 4,155 (286) (6,975) 5,579 357 Income (loss) before income taxes 35,425 (543,343) Income tax (provision) benefit (2,222) 114,667 Net income (loss) 33,203 (428,676) Less: Net loss attributable to noncontrolling interests Net income (loss) attributable to MGM Holdings Inc. (705) 33,908 (576) (428,100) $ $ The accompanying notes are an integral part of these consolidated financial statements. MGM Holdings Inc. Consolidated Statements of Comprehensive Income (Loss) (In thousands) Year Ended December 31, 2020 2019 Net income (loss) $ 33,203 $ (428,676) Other comprehensive loss, net of tax: Change in unrealized gain (loss) on securities Unrealized loss on derivative instruments Retirement plan adjustments Foreign currency translation adjustments Other comprehensive loss (58) (6,247) (337) 3,344 (3,298) 91 (15,601) (276) 352 (15,434) Less: Comprehensive loss attributable to noncontrolling interests Comprehensive income (loss) attributable to MGM Holdings Inc. (705) 30,610 (576) (443,534) $ $ The accompanying notes are an integral part of these consolidated financial statements. December 31, 2020 December 31, 2019 S S Assets Current assets: Cash and cash equivalents Accounts receivable, net Current income taxes receivable Other current assets and prepaid program rights Program rights, net Total current assets 284,109 490,310 1,988 40,290 162,956 979,653 243,189 609,170 1,040 30,468 147,001 1,030,868 Noncurrent assets: Accounts receivable, net Other assets and prepaid program rights Film and television costs and program rights, net Investments in affiliates Property and equipment, net Goodwill Other non-content intangible assets, net Total noncurrent assets 212,514 100,244 1,902,316 61,153 29,281 534,424 316,552 3,156,484 140,099 42,683 1,863,882 64,061 36,183 534,424 346,939 3,028,271 Total assets S 4.136,137 4,059,139 $ Liabilities and equity Current liabilities: Accounts payable and accrued liabilities Accrued participants' share Current income taxes payable Program obligations Corporate debt Advances and deferred revenue Other current liabilities Total current liabilities 344,903 66,585 9,892 61.675 237,436 91,014 7,179 58,264 5,154 86,726 50,957 536,730 4,000 114,563 22,512 624,130 74,197 167,266 21,393 Noncurrent liabilities: Accrued liabilities Accrued participants' share Deferred income taxes payable Corporate debt Advances and deferred revenue Other liabilities and program obligations Total noncurrent liabilities Total liabilities 1,981,289 9,690 94.606 2,348,441 2,885,171 142,180 174,960 31,762 1,822,648 5,485 28,584 2,205,619 2,829,749 Commitments and contingencies 791 790 Equity Class A common stock, S0.01 par value, 110,000,000 shares authorized, 79,162,612 and 79,046,798 shares issued, respectively, and 43,089,901 and 43,195,048 shares outstanding, respectively Additional paid-in capital Retained earnings Accumulated other comprehensive loss Treasury stock, at cost, 36,072,711 and 35,851,750 shares, respectively Total MGM Holdings Inc. stockholders' equity Noncontrolling interests Total equity Total liabilities and equity 2,155,113 1,094,160 (29,838) (1,969,938) 1,250,288 678 1,250,966 4,136,137 2,141,650 1,065,435 (26,540 (1,953,328) 1,228,007 1,383 1,229,390 4,059,139 S Consolidated Statements of Cash Flows (In thousands) Year Ended December 31, 2020 2019 S 33,203 $ (428,676) (732,440) 679,630 51,340 1,300 6,659 13,463 2,332 (1,012,897) 748,335 67,585 482,720 6,448 14,209 (393) (830) 10,701 (185) 4,406 (437) Operating activities Net income (loss) Adjustments to reconcile net income to net cash provided by operating activities: Additions to film and television costs and program rights, net Amortization of film and television costs and program rights Depreciation and non-content amortization Impairment of non-content intangible assets Amortization of deferred financing costs and original issue discount Stock-based compensation expense Provision for doubtful accounts Change in fair value of financial instruments Undistributed net losses (earnings) of affiliates Other non-cash expenses Changes in operating assets and liabilities: Accounts receivable, net Current income taxes receivable Other assets and prepaid program rights Accounts payable, accrued and other liabilities Accrued participants' share Current and deferred income taxes payable Program obligations Advances and deferred revenue Net cash provided by (used in) operating activities Investing activities Investments in affiliates Sale of investments Additions to property and equipment Net cash used in investing activities Financing activities Repayments of Term Loans Borrowings from Revolving Credit Facility Repayments of Revolving Credit Facility Principal payments of Finance Leases Assignment of Borrowings from Existing Lender Assumption of Borrowings by New Lender Payment of contingent consideration Issuance of common stock Purchase of treasury stock Net cash provided by financing activities Net change in cash and cash equivalents from operating, investing and financing activities Net change in cash due to foreign currency fluctuations Net change in cash and cash equivalents Cash and cash equivalents at beginning of year Cash and cash equivalents at end of year 44,111 (948) 25,716 (68,484) 16,735 (10,547) (846) (23,632) 41,561 (109,745) 22,590 (19,067) 51,473 (20,245) (127,237) (2,846) 31,272 (286,788) (15,341) 13,843 (12,691) (14,189) (16,961) 1,423 (23,197) (38,735) (4,000) 645,000 (485,000) (1,137) (4,000) 720,000 (360,000) (84,758) 84,758 (5,500) 1 (140,159) 9,205 3,257 (7,388) 351,869 36,577 4,343 40,920 243,189 284,109 26,346 457 26,803 216,386 243,189 $ S The accompanying notes are an integral part of these consolidated financial statements. MGM Holdings Inc. Consolidated Statements of Operations (In thousands) Year Ended December 31, 2020 2019 Revenue $ 1,496,997 $ 1,543,348 Expenses: Operating Distribution and marketing General and administrative Depreciation and non-content amortization Impairment of non-content intangible assets Total expenses 998,500 55,432 270,390 51,340 1,300 1,376,962 1,073,621 129,039 239,303 67,585 482,720 1,992,268 Operating income (loss) 120,035 (448,920) (1,013) (8,296) (80,235) (85,088) Equity in net losses of affiliates Interest expense: Contractual interest expense Amortization of deferred financing costs, original issue discount and other interest costs Interest income Other income (expense), net (7,231) 4,155 (286) (6,975) 5,579 357 Income (loss) before income taxes 35,425 (543,343) Income tax (provision) benefit (2,222) 114,667 Net income (loss) 33,203 (428,676) Less: Net loss attributable to noncontrolling interests Net income (loss) attributable to MGM Holdings Inc. (705) 33,908 (576) (428,100) $ $ The accompanying notes are an integral part of these consolidated financial statements. MGM Holdings Inc. Consolidated Statements of Comprehensive Income (Loss) (In thousands) Year Ended December 31, 2020 2019 Net income (loss) $ 33,203 $ (428,676) Other comprehensive loss, net of tax: Change in unrealized gain (loss) on securities Unrealized loss on derivative instruments Retirement plan adjustments Foreign currency translation adjustments Other comprehensive loss (58) (6,247) (337) 3,344 (3,298) 91 (15,601) (276) 352 (15,434) Less: Comprehensive loss attributable to noncontrolling interests Comprehensive income (loss) attributable to MGM Holdings Inc. (705) 30,610 (576) (443,534) $ $ The accompanying notes are an integral part of these consolidated financial statements


