

Question
For my class I need to graph the frequency of occurrence of each gray level for the image Flower.jpg that size [512, 512]. We cannot
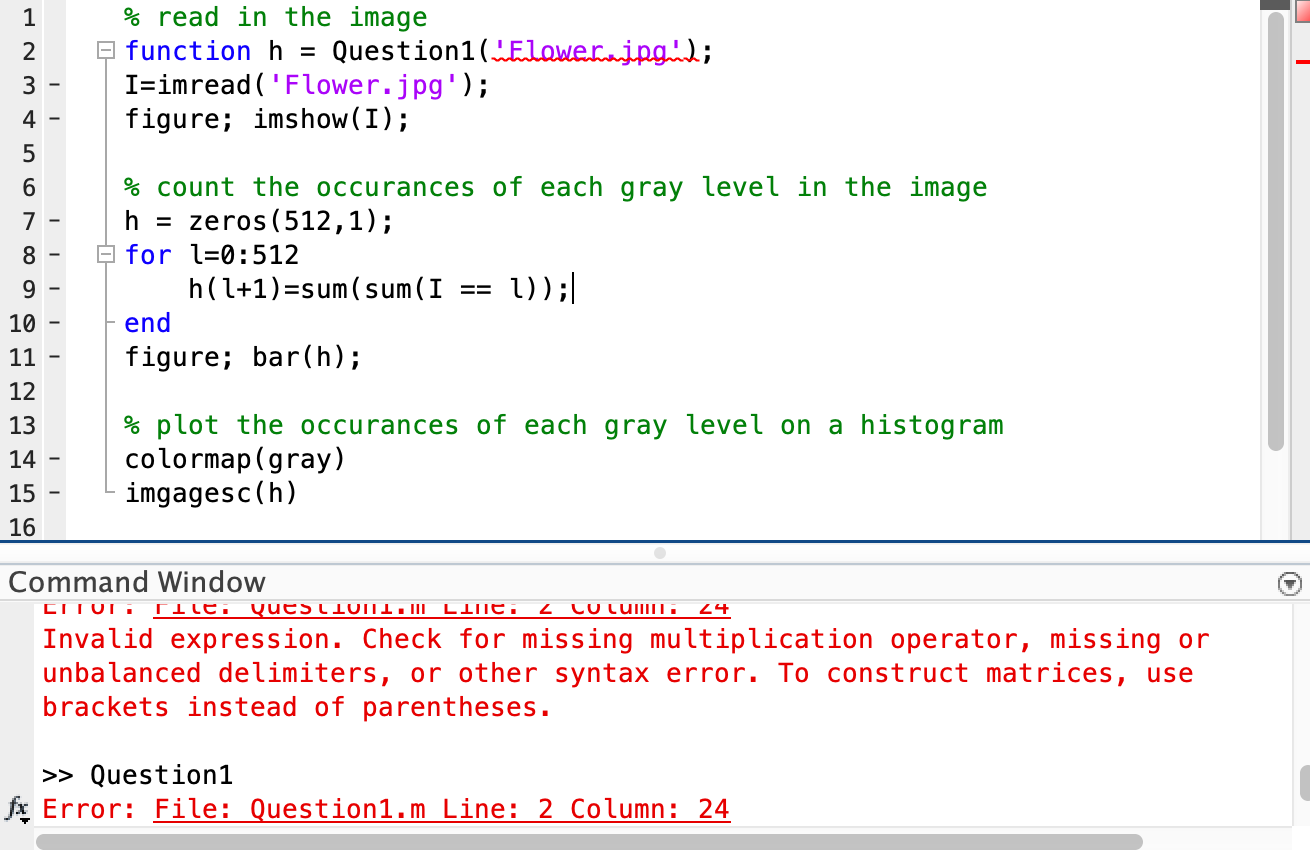
For my class I need to graph the frequency of occurrence of each gray level for the image Flower.jpg that size [512, 512]. We cannot use the built in histogram function in MATlab an I am having trouble making a function that calculates the occurrences and plots on the histogram. Here is the code I attempted to use please help me fix it so the code will run and properly answer the question
Step by Step Solution
There are 3 Steps involved in it
Step: 1

Get Instant Access to Expert-Tailored Solutions
See step-by-step solutions with expert insights and AI powered tools for academic success
Step: 2

Step: 3
Ace Your Homework with AI
Get the answers you need in no time with our AI-driven, step-by-step assistance
Get Started
Introductory Relational Database Design For Business With Microsoft Access
Authors: Jonathan Eckstein, Bonnie R. Schultz
1st Edition
1119329418, 978-1119329411