

Answered step by step
Verified Expert Solution
Question
1 Approved Answer
For PayPal Corporation. I just need help solving part B. Income statement for PayPal. Balance Sheet for PayPal corporation. Estimating and interpreting the main financial
 For PayPal Corporation. I just need help solving part B.
 Income statement for PayPal.
Balance Sheet for PayPal corporation.
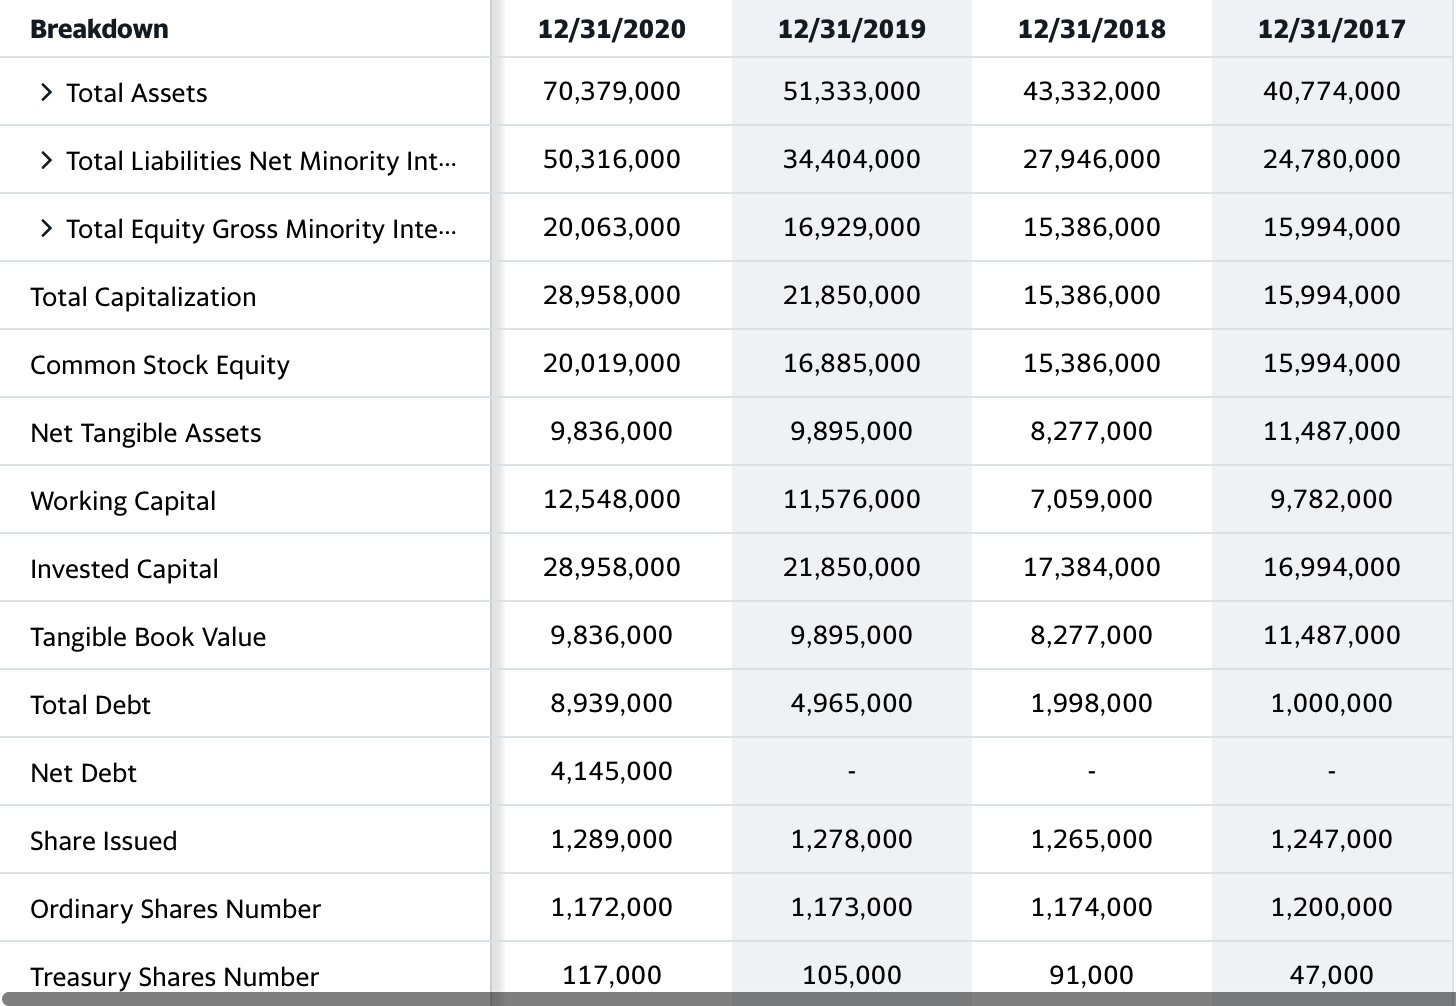
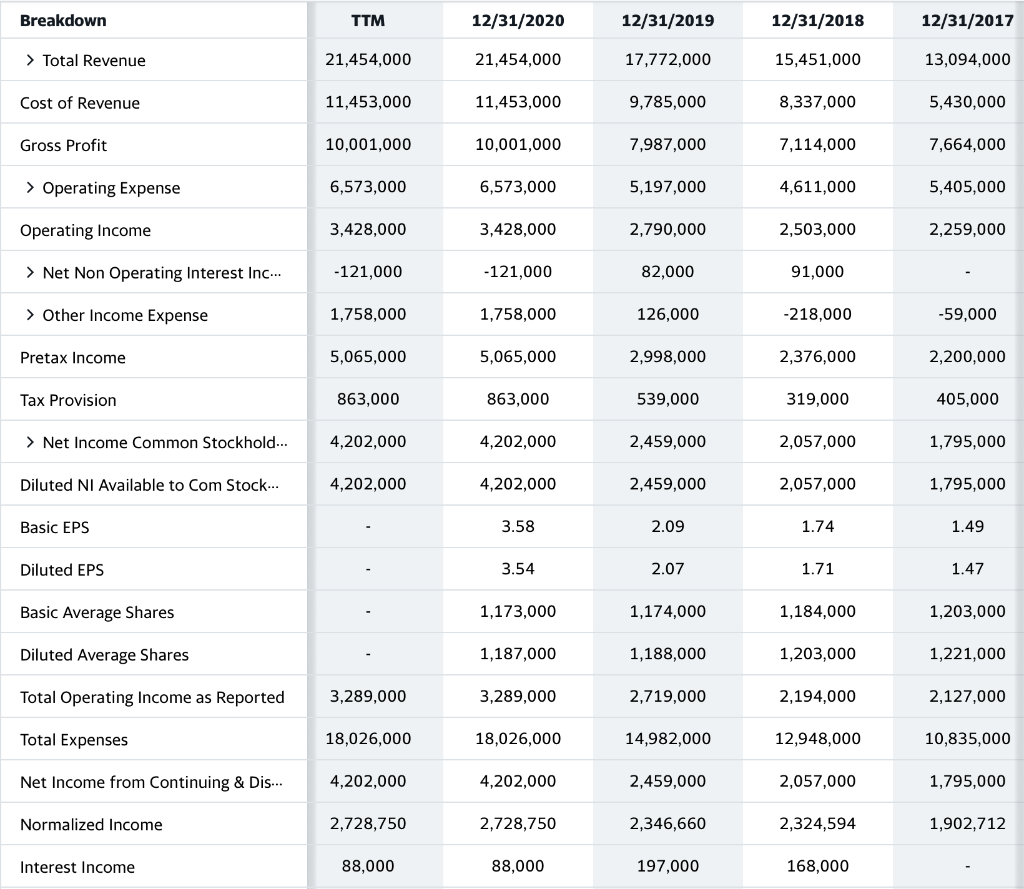
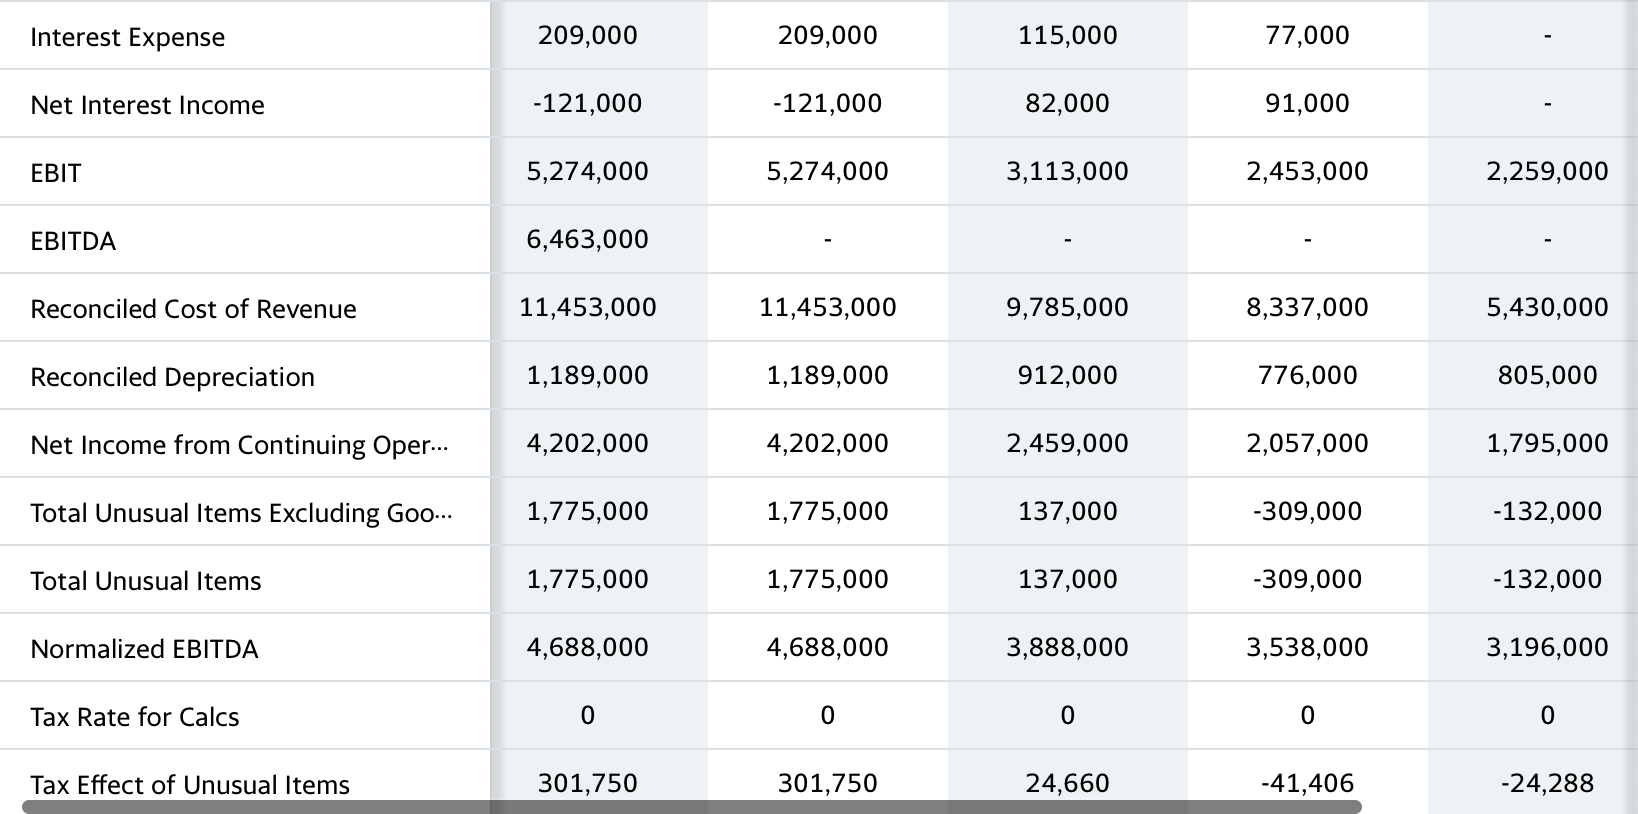
Estimating and interpreting the main financial ratios over the last 3 years (20 points) You should use the information available in the balance sheets and income statements for years 2018, 2019, and 2020. You can either copy this information from Yahoo Finance to an Excel sheet or take screenshots of the data. Next, you need to mark the relevant account items that you used to estimate each financial ratio. The key requirements of this sub-section are as described below: (b) Sharing in a table the DuPont ROE decomposition of your firm and that of its main competitor and explaining the main patterns. (10 points) Breakdown TTM 12/31/2020 12/31/2019 12/31/2018 12/31/2017 > Total Revenue 21,454,000 21,454,000 17,772,000 15,451,000 13,094,000 Cost of Revenue 11,453,000 11,453,000 9,785,000 8,337,000 5,430,000 Gross Profit 10,001,000 10,001,000 7,987,000 7,114,000 7,664,000 > Operating Expense 6,573,000 6,573,000 5,197,000 4,611,000 5,405,000 Operating Income 3,428,000 3,428,000 2,790,000 2,503,000 2,259,000 > Net Non Operating Interest Inc... -121,000 -121,000 82,000 91,000 > Other Income Expense 1,758,000 1,758,000 126,000 -218,000 -59,000 Pretax Income 5,065,000 5,065,000 2,998,000 2,376,000 2,200,000 Tax Provision 863,000 863,000 539,000 319,000 405,000 > Net Income Common Stockhold... 4,202,000 4,202,000 2,459,000 2,057,000 1,795,000 Diluted NI Available to Com Stock... 4,202,000 4,202,000 2,459,000 2,057,000 1,795,000 Basic EPS 3.58 2.09 1.74 1.49 Diluted EPS 3.54 2.07 1.71 1.47 Basic Average Shares 1,173,000 1,174,000 1,184,000 1,203,000 Diluted Average Shares 1,187,000 1,188,000 1,203,000 1,221,000 Total Operating Income as Reported 3,289,000 3,289,000 2,719,000 2,194,000 2,127,000 Total Expenses 18,026,000 18,026,000 14,982,000 12,948,000 10,835,000 Net Income from Continuing & Dis... 4,202,000 4,202,000 2,459,000 2,057,000 1,795,000 Normalized Income 2,728,750 2,728,750 2,346,660 2,324,594 1,902,712 Interest Income 88,000 88,000 197,000 168,000 Interest Expense 209,000 209,000 115,000 77,000 Net Interest Income -121,000 -121,000 82,000 91,000 EBIT 5,274,000 5,274,000 3,113,000 2,453,000 2,259,000 EBITDA 6,463,000 Reconciled Cost of Revenue 11,453,000 11,453,000 9,785,000 8,337,000 5,430,000 Reconciled Depreciation 1,189,000 1,189,000 912,000 776,000 805,000 Net Income from Continuing Oper... 4,202,000 4,202,000 2,459,000 2,057,000 1,795,000 Total Unusual Items Excluding Goo... 1,775,000 1,775,000 137,000 -309,000 -132,000 Total Unusual Items 1,775,000 1,775,000 137,000 -309,000 -132,000 Normalized EBITDA 4,688,000 4,688,000 3,888,000 3,538,000 3,196,000 Tax Rate for Calcs 0 0 0 0 0 Tax Effect of Unusual Items 301,750 301,750 24,660 -41,406 -24,288 Breakdown 12/31/2020 12/31/2019 12/31/2018 12/31/2017 Total Assets 70,379,000 51,333,000 43,332,000 40,774,000 > Total Liabilities Net Minority Int... 50,316,000 34,404,000 27,946,000 24,780,000 > Total Equity Gross Minority Inte... 20,063,000 16,929,000 15,386,000 15,994,000 Total Capitalization 28,958,000 21,850,000 15,386,000 15,994,000 Common Stock Equity 20,019,000 16,885,000 15,386,000 15,994,000 Net Tangible Assets 9,836,000 9,895,000 8,277,000 11,487,000 Working Capital 12,548,000 11,576,000 7,059,000 9,782,000 Invested Capital 28,958,000 21,850,000 17,384,000 16,994,000 Tangible Book Value 9,836,000 9,895,000 8,277,000 11,487,000 Total Debt 8,939,000 4,965,000 1,998,000 1,000,000 Net Debt 4,145,000 Share Issued 1,289,000 1,278,000 1,265,000 1,247,000 Ordinary Shares Number 1,172,000 1,173,000 1,174,000 1,200,000 Treasury Shares Number 117,000 105,000 91,000 47,000
Step by Step Solution
There are 3 Steps involved in it
Step: 1

Get Instant Access to Expert-Tailored Solutions
See step-by-step solutions with expert insights and AI powered tools for academic success
Step: 2

Step: 3
Ace Your Homework with AI
Get the answers you need in no time with our AI-driven, step-by-step assistance
Get Started
Crisis Risk And Stability In Financial Markets
Authors: Juan Fernández De Guevara Radoselovics , José Pastor Monsálvez
1st Edition
1137001828, 978-1137001825