

Answered step by step
Verified Expert Solution
Question
1 Approved Answer
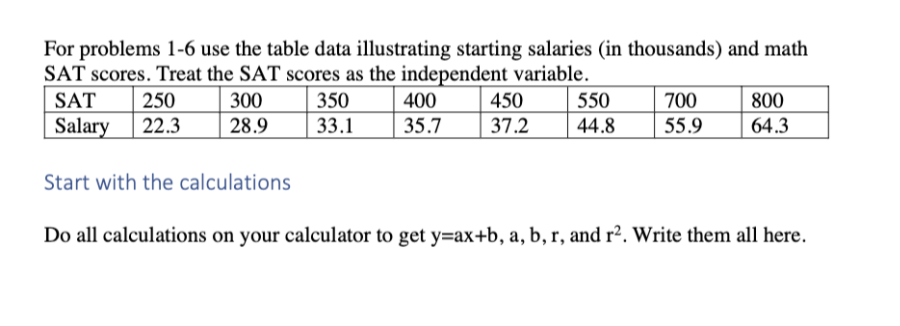
For problems 1-6 use the table data illustrating starting salaries (in thousands) and math SAT scores. Treat the SAT scores as the independent variable. SAT
Step by Step Solution
There are 3 Steps involved in it
Step: 1

Get Instant Access to Expert-Tailored Solutions
See step-by-step solutions with expert insights and AI powered tools for academic success
Step: 2

Step: 3
Ace Your Homework with AI
Get the answers you need in no time with our AI-driven, step-by-step assistance
Get Started
College Algebra And Trigonometry A Unit Circle Approach,
Authors: Mark Dugopolski
5th Edition
0321908252, 9780321908254