Answered step by step
Verified Expert Solution
Question
1 Approved Answer
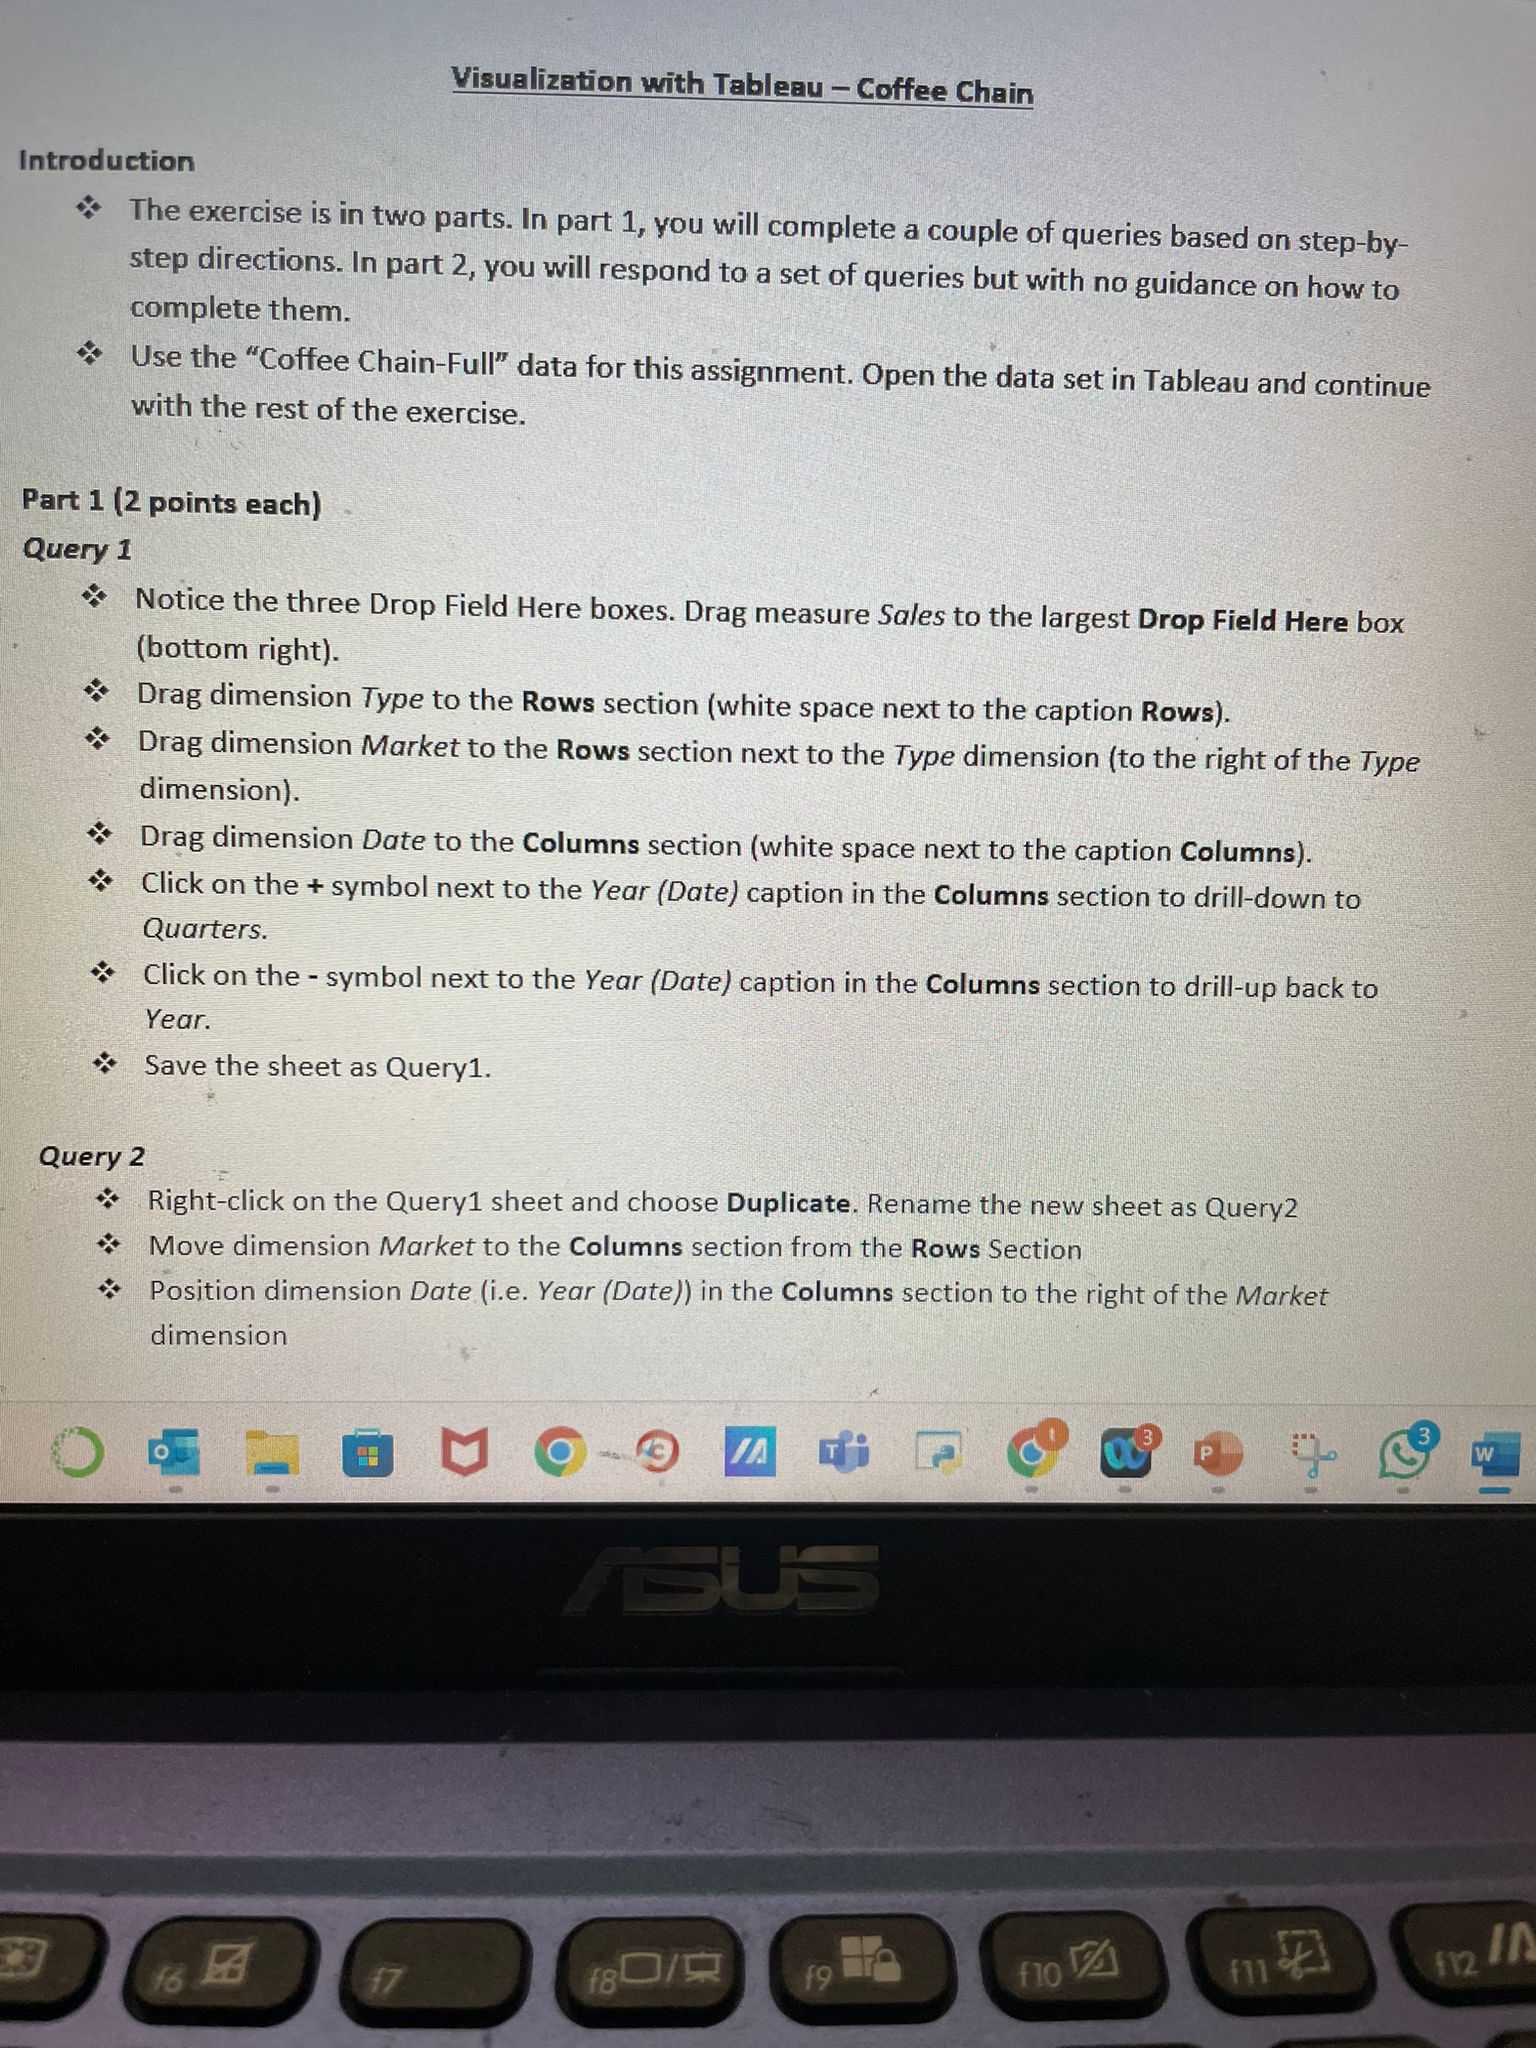
For query 1 give me direction Visualization with Tableau - Coffee Chain Introduction The exercise is in two parts. In part 1 , you will
For query give me direction Visualization with Tableau Coffee Chain
Introduction
The exercise is in two parts. In part you will complete a couple of queries based on stepby
step directions. In part you will respond to a set of queries but with no guidance on how to
complete them.
Use the "Coffee ChainFull" data for this assignment. Open the data set in Tableau and continue
with the rest of the exercise.
Part points each
Query
Notice the three Drop Field Here boxes. Drag measure Sales to the largest Drop Field Here box
bottom right
Drag dimension Type to the Rows section white space next to the caption Rows
Drag dimension Market to the Rows section next to the Type dimension to the right of the Type
dimension
Drag dimension Date to the Columns section white space next to the caption Columns
Click on the symbol next to the Year Date caption in the Columns section to drilldown to
Quarters.
Click on the symbol next to the Year Date caption in the Columns section to drillup back to
Year.
Save the sheet as Query
Query
Rightclick on the Query sheet and choose Duplicate. Rename the new sheet as Query
Move dimension Market to the Columns section from the Rows Section
Position dimension Date ie Year Date in the Columns section to the right of the Market
dimension

Step by Step Solution
There are 3 Steps involved in it
Step: 1

Get Instant Access to Expert-Tailored Solutions
See step-by-step solutions with expert insights and AI powered tools for academic success
Step: 2

Step: 3

Ace Your Homework with AI
Get the answers you need in no time with our AI-driven, step-by-step assistance
Get Started


