

Answered step by step
Verified Expert Solution
Question
1 Approved Answer
FOR QUESTION 3 USING R PROGRAMMING! THE LINK TO THE DATASET: https://drive.google.com/file/d/18JBe3v-mNv32Ga-H5Ngaiymo-RdBHHXN/view?usp=share_link StudentsPerformance.csv is a performance record for three courses in a university. Using R,
FOR QUESTION 3 USING R PROGRAMMING! THE LINK TO THE DATASET: https://drive.google.com/file/d/18JBe3v-mNv32Ga-H5Ngaiymo-RdBHHXN/view?usp=share_link
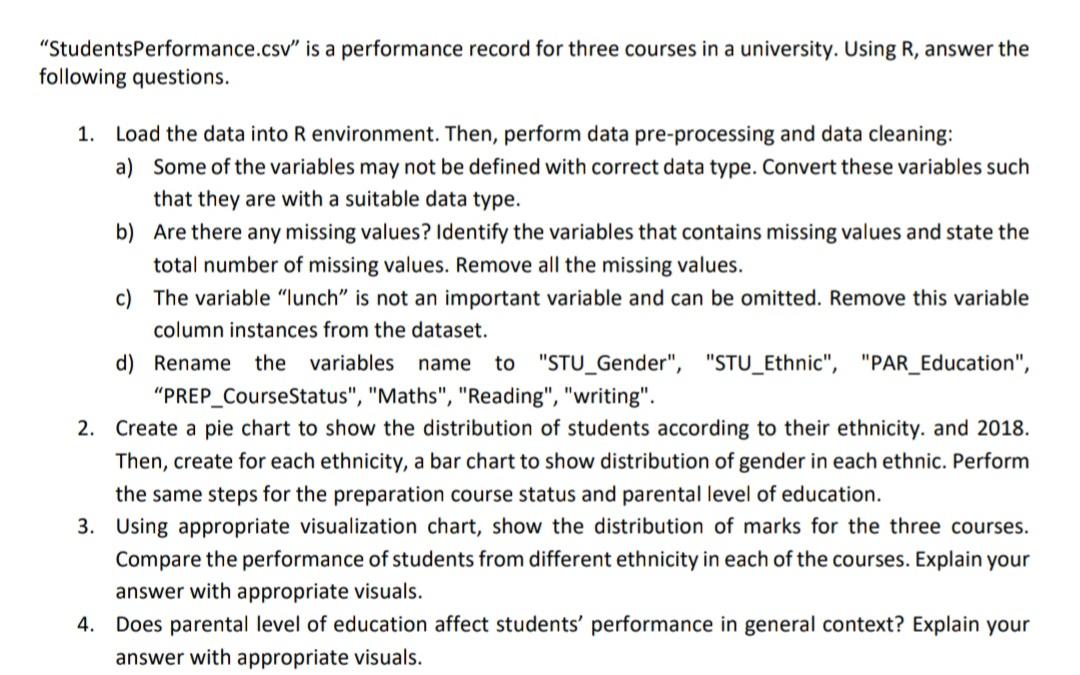
"StudentsPerformance.csv" is a performance record for three courses in a university. Using R, answer the ollowing questions. 1. Load the data into R environment. Then, perform data pre-processing and data cleaning: a) Some of the variables may not be defined with correct data type. Convert these variables such that they are with a suitable data type. b) Are there any missing values? Identify the variables that contains missing values and state the total number of missing values. Remove all the missing values. c) The variable "lunch" is not an important variable and can be omitted. Remove this variable column instances from the dataset. d) Rename the variables name to "STU_Gender", "STU_Ethnic", "PAR_Education", "PREP_CourseStatus", "Maths", "Reading", "writing". 2. Create a pie chart to show the distribution of students according to their ethnicity. and 2018. Then, create for each ethnicity, a bar chart to show distribution of gender in each ethnic. Perform the same steps for the preparation course status and parental level of education. 3. Using appropriate visualization chart, show the distribution of marks for the three courses. Compare the performance of students from different ethnicity in each of the courses. Explain your answer with appropriate visuals. 4. Does parental level of education affect students' performance in general context? Explain your answer with appropriate visualsStep by Step Solution
There are 3 Steps involved in it
Step: 1

Get Instant Access to Expert-Tailored Solutions
See step-by-step solutions with expert insights and AI powered tools for academic success
Step: 2

Step: 3
Ace Your Homework with AI
Get the answers you need in no time with our AI-driven, step-by-step assistance
Get Started
Transactions On Large Scale Data And Knowledge Centered Systems Iv Special Issue On Database Systems For Biomedical Applications Lncs 6990
Authors: Abdelkader Hameurlain ,Josef Kung ,Roland Wagner ,Christian Bohm ,Johann Eder ,Claudia Plant
2011th Edition