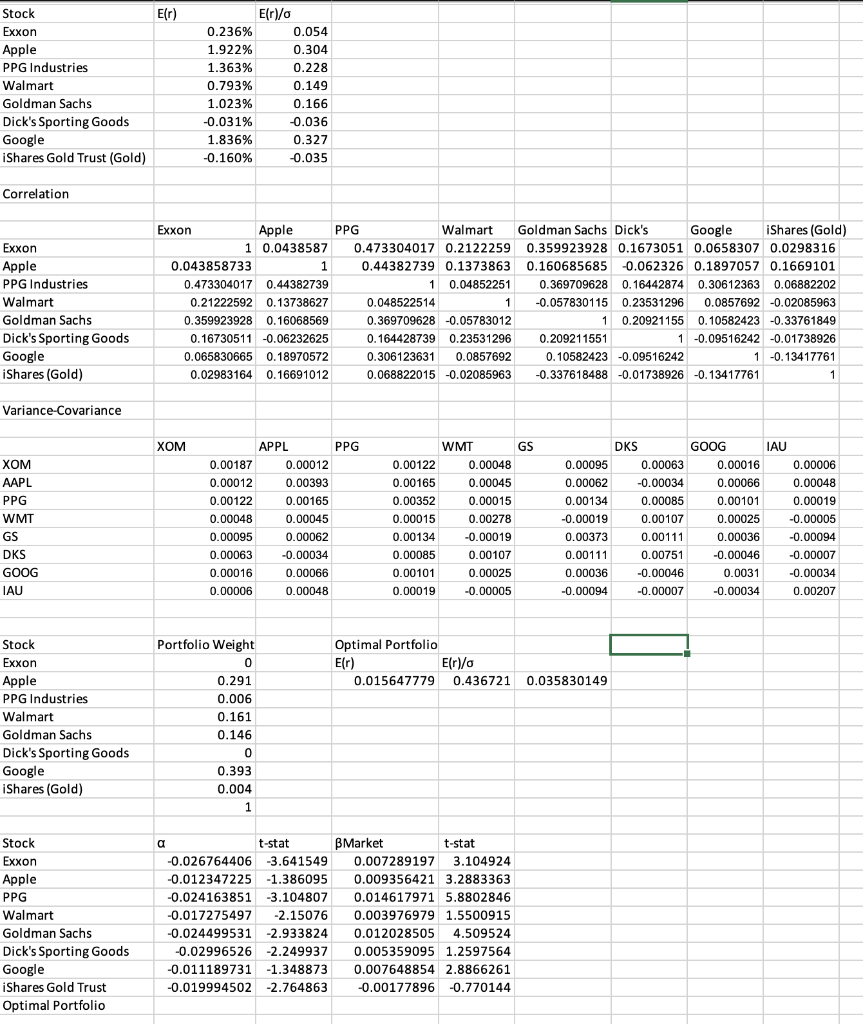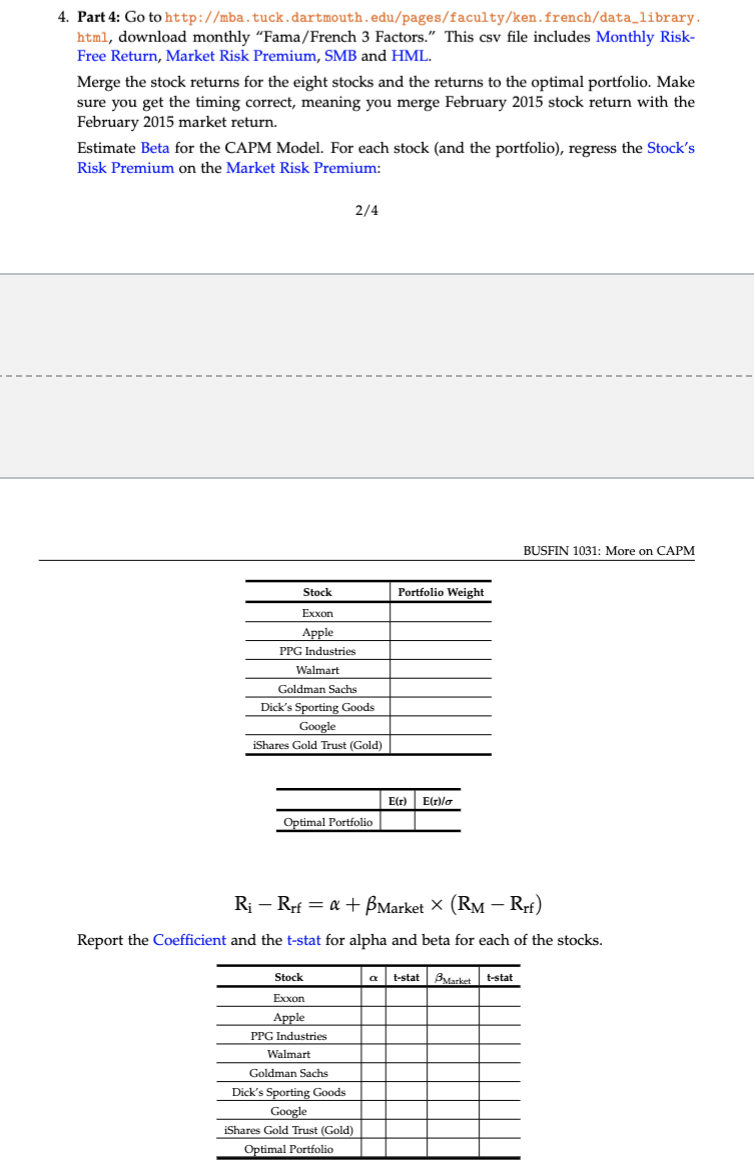
 For question 4: I just need the answers to the optimal portfolio, the last row. First picture is my work so far.
E(r) Stock Exxon Apple PPG Industries Walmart Goldman Sachs Dick's Sporting Goods Google iShares Gold Trust (Gold) 0.236% 1.922% 1.363% 0.793% 1.023% -0.031% 1.836% -0.160% E(r)/ 0.054 0.304 0.228 0.149 0.166 -0.036 0.327 -0.035 Correlation Exxon Apple PPG Industries Walmart Goldman Sachs Dick's Sporting Goods Google iShares (Gold) Exxon Apple 1 0.0438587 0.043858733 1 0.473304017 0.44382739 0.21222592 0.13738627 0.359923928 0.16068569 0.16730511 -0.06232625 0.065830665 0.18970572 0.02983164 0.16691012 PPG Walmart Goldman Sachs Dick's Google iShares (Gold) 0.473304017 0.2122259 0.359923928 0.1673051 0.0658307 0.0298316 0.44382739 0.1373863 0.160685685 0.062326 0.1897057 0.1669101 1 0.04852251 0.369709628 0.16442874 0.30612363 0.06882202 0.048522514 1 -0.057830115 0.23531296 0.0857692 -0.02085963 0.369709628 -0.05783012 1 0.20921155 0.10582423 -0.33761849 0.164428739 0.23531296 0.209211551 1 -0.09516242 -0.01738926 0.306123631 0.0857692 0.10582423 -0.09516242 1 -0.13417761 0.068822015 -0.02085963 -0.337618488 -0.01738926 -0.13417761 1 Variance-Covariance XOM XOM AAPL PPG WMT GS DKS GOOG IAU APPL PPG 0.00187 0.00012 0.00012 0.00393 0.00122 0.00165 0.00048 0.00045 0.00095 0.00062 0.00063 -0.00034 0.00016 0.00066 0.00006 0.00048 WMT GS 0.00122 0.00048 0.00165 0.00045 0.00352 0.00015 0.00015 0.00278 0.00134 -0.00019 0.00085 0.00107 0.00101 0.00025 0.00019 -0.00005 DKS GOOG IAU 0.00095 0.00063 0.00016 0.00006 0.00062 -0.00034 0.00066 0.00048 0.00134 0.00085 0.00101 0.00019 -0.00019 0.00107 0.00025 -0.00005 0.00373 0.00111 0.00036 -0.00094 0.00111 0.00751 -0.00046 -0.00007 0.00036 -0.00046 0.0031 -0.00034 -0.00094 -0.00007 -0.00034 0.00207 Stock Optimal Portfolio Elr) E()/ 0.015647779 0.436721 0.035830149 Exxon Apple PPG Industries Walmart Goldman Sachs Dick's Sporting Goods Google iShares (Gold) Portfolio Weight 0 0.291 0.006 0.161 0.146 0 0.393 0.004 1 Stock Exxon Apple PPG Walmart Goldman Sachs Dick's Sporting Goods Google iShares Gold Trust Optimal Portfolio a t-stat -0.026764406 -3.641549 -0.012347225 -1.386095 -0.024163851 -3.104807 -0.017275497 -2.15076 -0.024499531 -2.933824 -0.02996526 -2.249937 -0.011189731 -1.348873 -0.019994502 -2.764863 BMarket t-stat 0.007289197 3.104924 0.009356421 3.2883363 0.014617971 5.8802846 0.003976979 1.5500915 0.012028505 4.509524 0.005359095 1.2597564 0.007648854 2.8866261 -0.00177896 -0.770144 4. Part 4: Go to http://mba.tuck.dartmouth.edu/pages/faculty/ken.french/data_library. html, download monthly "Fama/French 3 Factors." This csv file includes Monthly Risk- Free Return, Market Risk Premium, SMB and HML. Merge the stock returns for the eight stocks and the returns to the optimal portfolio. Make sure you get the timing correct, meaning you merge February 2015 stock return with the February 2015 market return. Estimate Beta for the CAPM Model. For each stock (and the portfolio), regress the Stock's Risk Premium on the Market Risk Premium: 2/4 BUSFIN 1031: More on CAPM Stock Portfolio Weight Exxon Apple PPG Industries Walmart Goldman Sachs Dick's Sporting Goods Google iShares Gold Trust (Gold) E) EIr/ Optimal Portfolio R; - Ref = a + BMarket X (RM - Rrf) Report the Coefficient and the t-stat for alpha and beta for each of the stocks. a t-stat Barket t-stat Stock Exxon Apple PPG Industries Walmart Goldman Sachs Dick's Sporting Goods Google iShares Gold Trust (Gold) Optimal Portfolio E(r) Stock Exxon Apple PPG Industries Walmart Goldman Sachs Dick's Sporting Goods Google iShares Gold Trust (Gold) 0.236% 1.922% 1.363% 0.793% 1.023% -0.031% 1.836% -0.160% E(r)/ 0.054 0.304 0.228 0.149 0.166 -0.036 0.327 -0.035 Correlation Exxon Apple PPG Industries Walmart Goldman Sachs Dick's Sporting Goods Google iShares (Gold) Exxon Apple 1 0.0438587 0.043858733 1 0.473304017 0.44382739 0.21222592 0.13738627 0.359923928 0.16068569 0.16730511 -0.06232625 0.065830665 0.18970572 0.02983164 0.16691012 PPG Walmart Goldman Sachs Dick's Google iShares (Gold) 0.473304017 0.2122259 0.359923928 0.1673051 0.0658307 0.0298316 0.44382739 0.1373863 0.160685685 0.062326 0.1897057 0.1669101 1 0.04852251 0.369709628 0.16442874 0.30612363 0.06882202 0.048522514 1 -0.057830115 0.23531296 0.0857692 -0.02085963 0.369709628 -0.05783012 1 0.20921155 0.10582423 -0.33761849 0.164428739 0.23531296 0.209211551 1 -0.09516242 -0.01738926 0.306123631 0.0857692 0.10582423 -0.09516242 1 -0.13417761 0.068822015 -0.02085963 -0.337618488 -0.01738926 -0.13417761 1 Variance-Covariance XOM XOM AAPL PPG WMT GS DKS GOOG IAU APPL PPG 0.00187 0.00012 0.00012 0.00393 0.00122 0.00165 0.00048 0.00045 0.00095 0.00062 0.00063 -0.00034 0.00016 0.00066 0.00006 0.00048 WMT GS 0.00122 0.00048 0.00165 0.00045 0.00352 0.00015 0.00015 0.00278 0.00134 -0.00019 0.00085 0.00107 0.00101 0.00025 0.00019 -0.00005 DKS GOOG IAU 0.00095 0.00063 0.00016 0.00006 0.00062 -0.00034 0.00066 0.00048 0.00134 0.00085 0.00101 0.00019 -0.00019 0.00107 0.00025 -0.00005 0.00373 0.00111 0.00036 -0.00094 0.00111 0.00751 -0.00046 -0.00007 0.00036 -0.00046 0.0031 -0.00034 -0.00094 -0.00007 -0.00034 0.00207 Stock Optimal Portfolio Elr) E()/ 0.015647779 0.436721 0.035830149 Exxon Apple PPG Industries Walmart Goldman Sachs Dick's Sporting Goods Google iShares (Gold) Portfolio Weight 0 0.291 0.006 0.161 0.146 0 0.393 0.004 1 Stock Exxon Apple PPG Walmart Goldman Sachs Dick's Sporting Goods Google iShares Gold Trust Optimal Portfolio a t-stat -0.026764406 -3.641549 -0.012347225 -1.386095 -0.024163851 -3.104807 -0.017275497 -2.15076 -0.024499531 -2.933824 -0.02996526 -2.249937 -0.011189731 -1.348873 -0.019994502 -2.764863 BMarket t-stat 0.007289197 3.104924 0.009356421 3.2883363 0.014617971 5.8802846 0.003976979 1.5500915 0.012028505 4.509524 0.005359095 1.2597564 0.007648854 2.8866261 -0.00177896 -0.770144 4. Part 4: Go to http://mba.tuck.dartmouth.edu/pages/faculty/ken.french/data_library. html, download monthly "Fama/French 3 Factors." This csv file includes Monthly Risk- Free Return, Market Risk Premium, SMB and HML. Merge the stock returns for the eight stocks and the returns to the optimal portfolio. Make sure you get the timing correct, meaning you merge February 2015 stock return with the February 2015 market return. Estimate Beta for the CAPM Model. For each stock (and the portfolio), regress the Stock's Risk Premium on the Market Risk Premium: 2/4 BUSFIN 1031: More on CAPM Stock Portfolio Weight Exxon Apple PPG Industries Walmart Goldman Sachs Dick's Sporting Goods Google iShares Gold Trust (Gold) E) EIr/ Optimal Portfolio R; - Ref = a + BMarket X (RM - Rrf) Report the Coefficient and the t-stat for alpha and beta for each of the stocks. a t-stat Barket t-stat Stock Exxon Apple PPG Industries Walmart Goldman Sachs Dick's Sporting Goods Google iShares Gold Trust (Gold) Optimal Portfolio

 For question 4: I just need the answers to the optimal portfolio, the last row. First picture is my work so far.


