Answered step by step
Verified Expert Solution
Link Copied!

Question

1 Approved Answer

FOR QUESTIONS 12-14, USE THE TABLE BELOW 12. In a report written for the office of institutional research at a 4-year institution in Southern California,
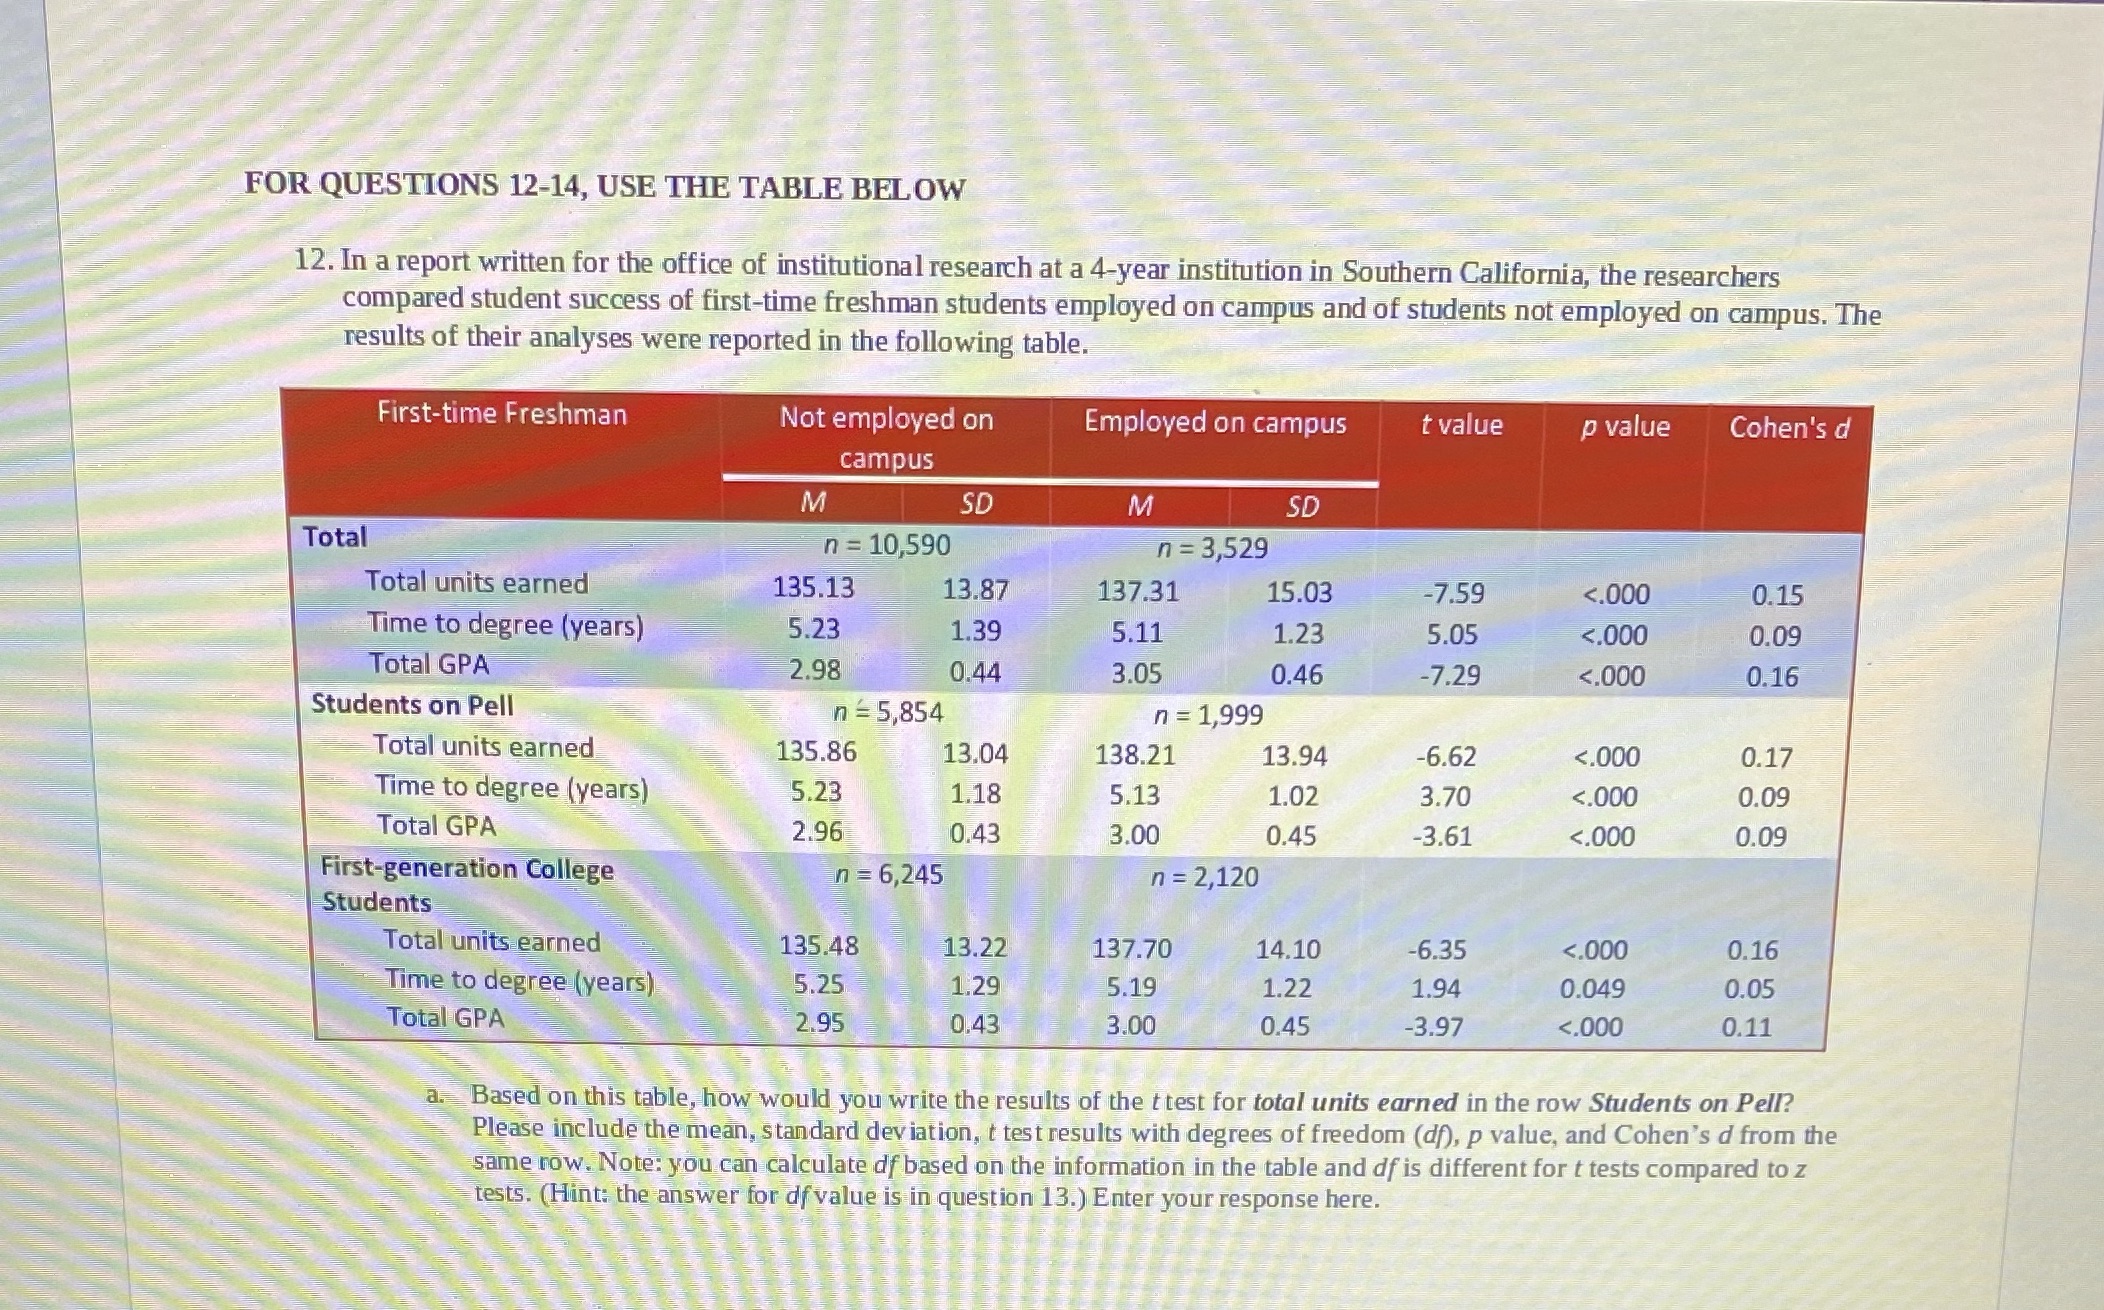
image text in transcribed
FOR QUESTIONS 12-14, USE THE TABLE BELOW 12. In a report written for the office of institutional research at a 4-year institution in Southern California, the researchers compared student success of first-time freshman students employed on campus and of students not employed on campus. The results of their analyses were reported in the following table. First-time Freshman Not employed on Employed on campus t value p value Cohen's d campus M SD M SD Total n = 10,590 n =3,529 Total units earned 135.13 13.87 137.31 15.03 -7.59 <.000 time to degree total gpa students on pell n="5,854" units earned first-generation college a. based this table how would you write the results of ttest for in row please include mean standard deviation t test with degrees freedom p value and cohen d from same row. note: can calculate df information is different tests compared z tests. answer question enter your response here>

Step by Step Solution

There are 3 Steps involved in it

Step: 1

blur-text-image

Get Instant Access to Expert-Tailored Solutions

See step-by-step solutions with expert insights and AI powered tools for academic success

Step: 2

blur-text-image

Step: 3

blur-text-image

Ace Your Homework with AI

Get the answers you need in no time with our AI-driven, step-by-step assistance

Get Started

Recommended Textbook for

Advanced Calculus

Authors: R Creighton Buck

3rd Edition

147861613X, 9781478616139

More Books

Students also viewed these Mathematics questions

Question

3. Explain the relationship of research and theory.

Answered: 1 week ago