Answered step by step
Verified Expert Solution
Question
1 Approved Answer
For small amplitude oscillations (deviation from vertical of less than about 10), the motion of a simple pendulum is very close to that of

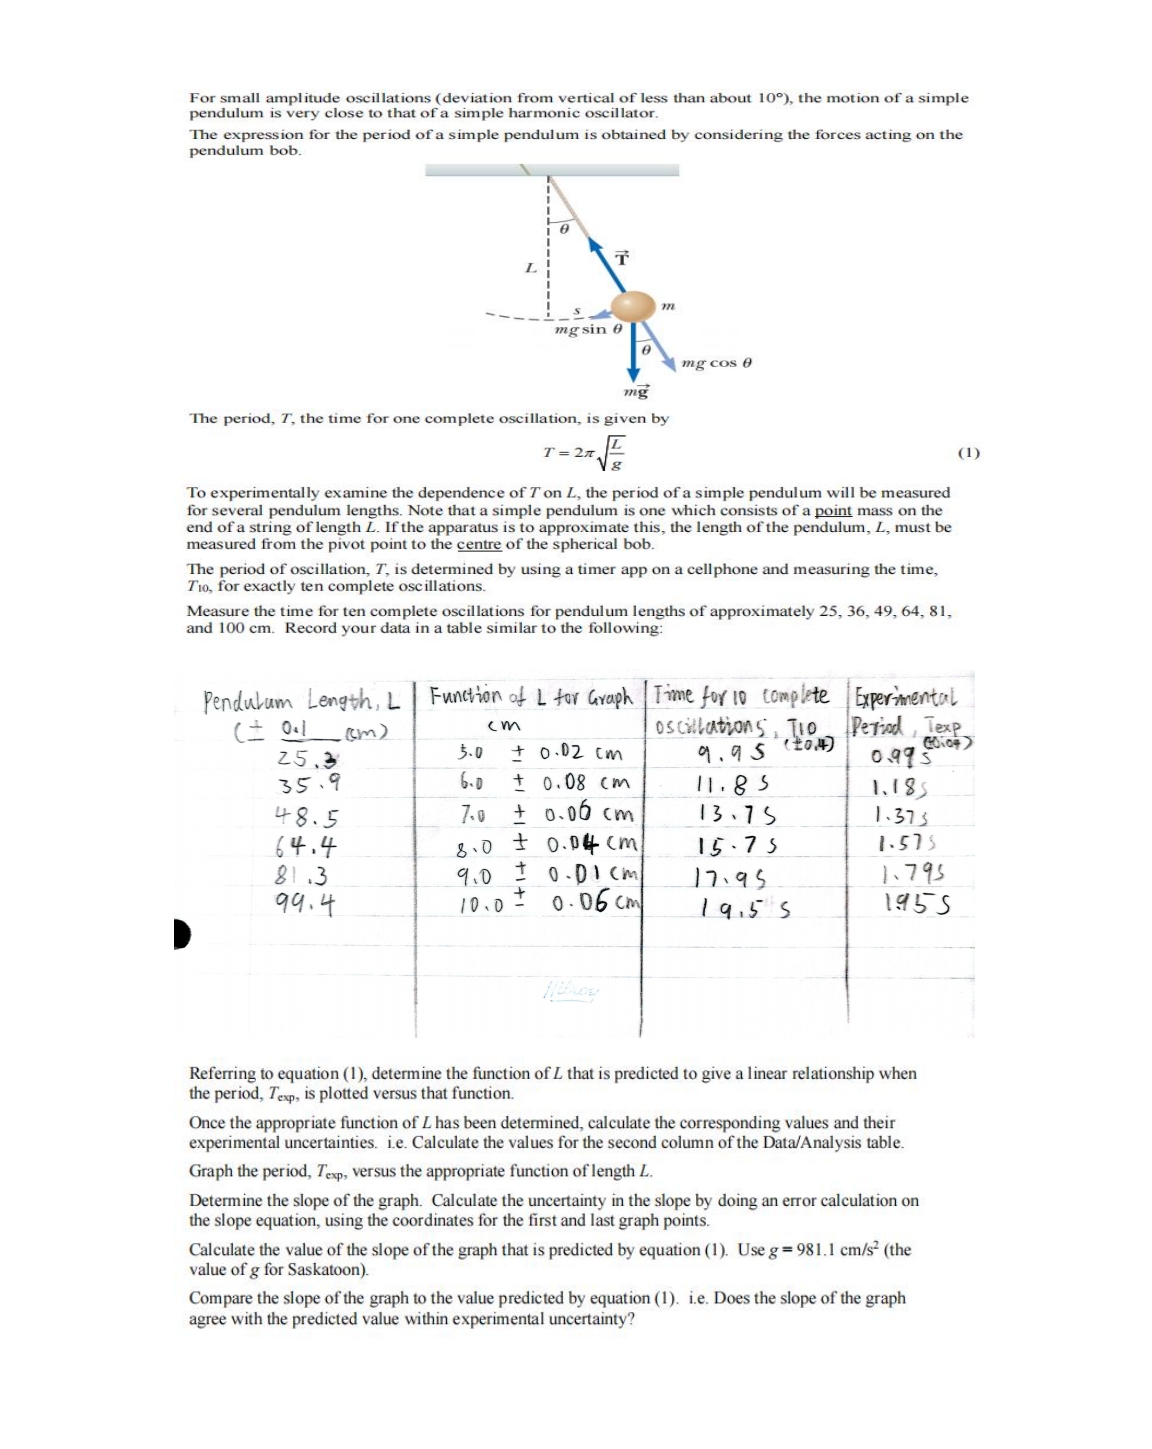
For small amplitude oscillations (deviation from vertical of less than about 10), the motion of a simple pendulum is very close to that of a simple harmonic oscillator. The expression for the period of a simple pendulum is obtained by considering the forces acting on the pendulum bob. mg sin mg m The period, T, the time for one complete oscillation, is given by T=2 g mg cos 0 To experimentally examine the dependence of T on L, the period of a simple pendulum will be measured for several pendulum lengths. Note that a simple pendulum is one which consists of a point mass on the end of a string of length L. If the apparatus is to approximate this, the length of the pendulum, L, must be measured from the pivot point to the centre of the spherical bob. The period of oscillation, T, is determined by using a timer app on a cellphone and measuring the time, T10, for exactly ten complete oscillations. Measure the time for ten complete oscillations for pendulum lengths of approximately 25, 36, 49, 64, 81, and 100 cm. Record your data in a table similar to the following: Pendulum Length, L Function of L for Graph Time for 10 complete ( 0.1 (m) cm Oscillations To Experimental Period, Texp 25.3 3.0 0.02 cm 9.95 (0.4) 60107 0.995 35.9 6.0 0.08 cm 11.85 1.185 48.5 7.0 0.06 cm 13.75 1.373 64.4 8.0 0.04 cm 15.75 1.575 81.3 9.0 0.01 cm 17.95 1.795 99.4 10.0 0.06 cm 1955 1955 Hiboy Referring to equation (1), determine the function of L that is predicted to give a linear relationship when the period, Texp, is plotted versus that function. Once the appropriate function of L has been determined, calculate the corresponding values and their experimental uncertainties. i.e. Calculate the values for the second column of the Data/Analysis table. Graph the period, Texp, versus the appropriate function of length L. Determine the slope of the graph. Calculate the uncertainty in the slope by doing an error calculation on the slope equation, using the coordinates for the first and last graph points. Calculate the value of the slope of the graph that is predicted by equation (1). Use g=981.1 cm/s (the value of g for Saskatoon). Compare the slope of the graph to the value predicted by equation (1). i.e. Does the slope of the graph agree with the predicted value within experimental uncertainty? (1)
Step by Step Solution
There are 3 Steps involved in it
Step: 1

Get Instant Access to Expert-Tailored Solutions
See step-by-step solutions with expert insights and AI powered tools for academic success
Step: 2

Step: 3

Ace Your Homework with AI
Get the answers you need in no time with our AI-driven, step-by-step assistance
Get Started


