Answered step by step
Verified Expert Solution
Question
1 Approved Answer
For tab state_violence: Highlight the 5 top states of high violence with pink color. Plot a column chart with average line of violence. The x-axis


For tab state_violence:
- Highlight the 5 top states of high violence with pink color.
- Plot a column chart with average line of violence. The x-axis labels are the state names.
- Use functions to find out the biggest and smallest value of violence. Divide the data into 6 groups like the following table (results are not the same, data changed). Calculate the frequency of groups with functions. Plot a frequency chart.
Paste all you results and answers in the following space, see my example in the following(the values in my example may be different from yours, but the groups are the same):
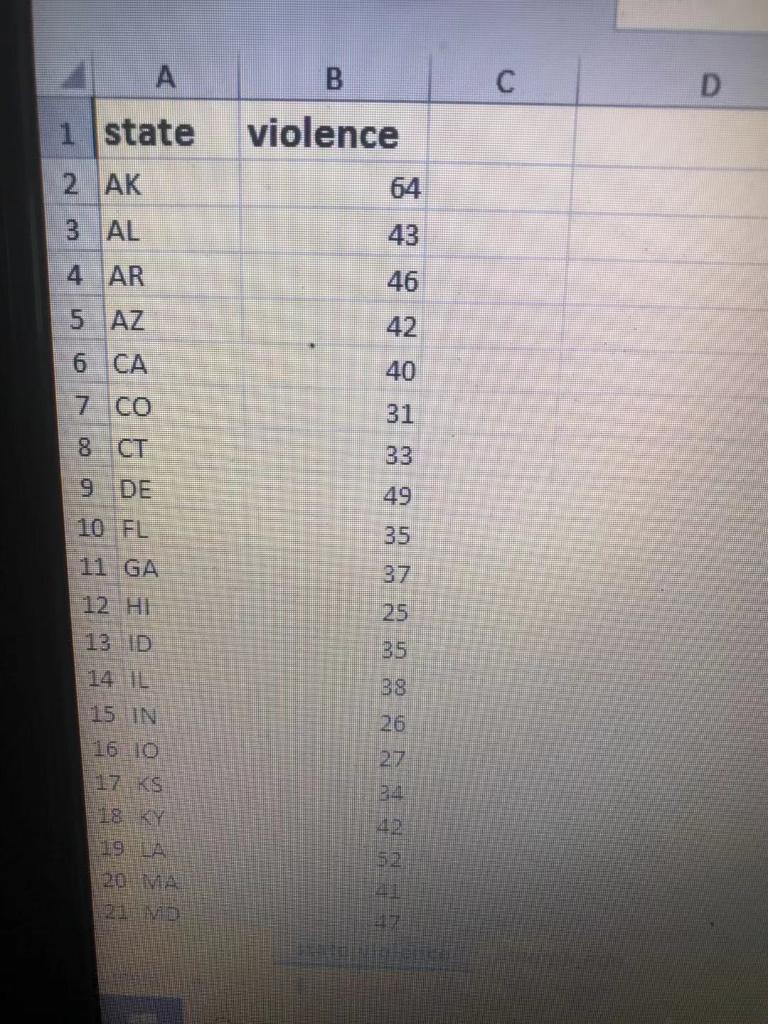
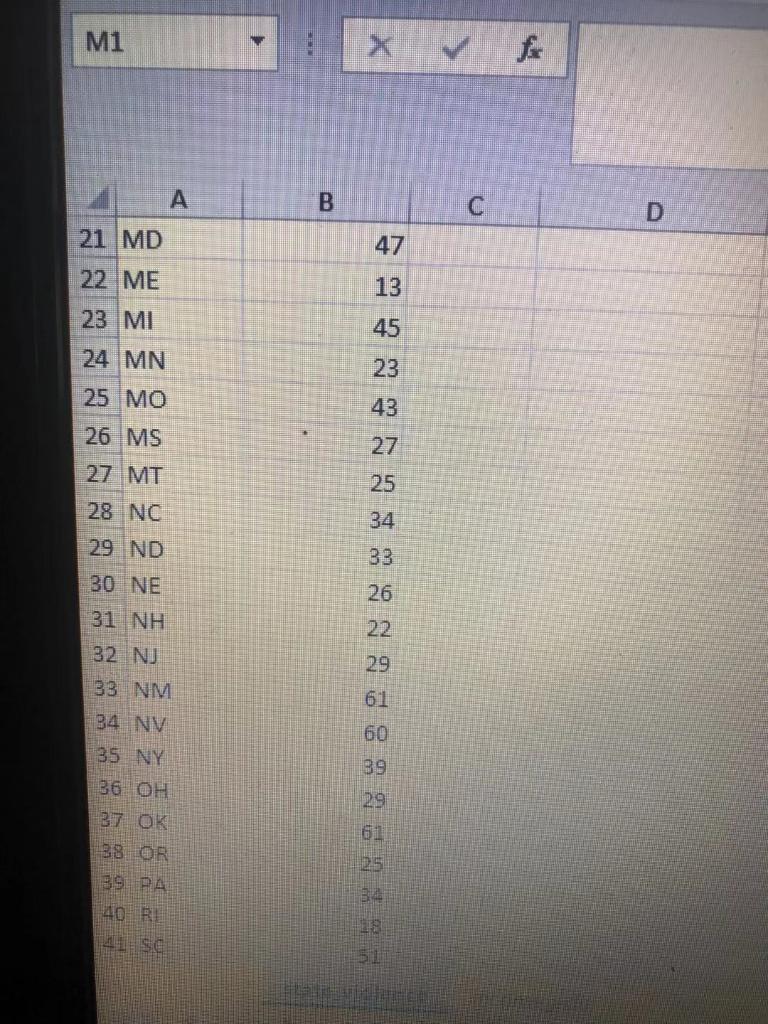
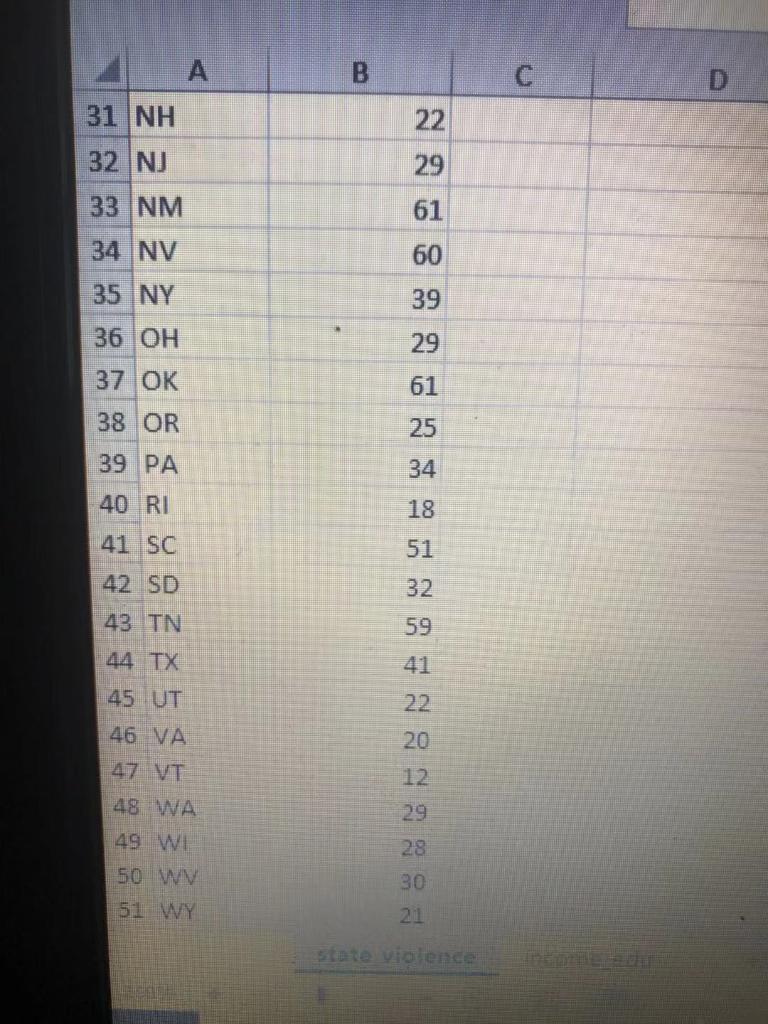
B. C D 1 state violence 2 AK 64 3 AL 43 46 4 AR 5 AZ 42 6 CA 40 7 31 8 CT 33 9 DE 49 10 FL 35 11 GA 37 12 HI 25 15 IN 16 10 27 18 KY 20 VA B. C D 1 state violence 2 AK 64 3 AL 43 46 4 AR 5 AZ 42 6 CA 40 7 31 8 CT 33 9 DE 49 10 FL 35 11 GA 37 12 HI 25 15 IN 16 10 27 18 KY 20 VA M1 B C D 21 MD 13 22 ME 23 MI 24 MN 45 23 25 MO 43 26 MS 27 27 MT 25 28 NC 29 ND 26 30 NE 31 NH 32 NJ 33 NM 60 34 NM 35 NY 36 OH 37 OK 01 391 PA 40 RI B C 22 31 NH 32 N) 29 61 33 NM 34 NV 60 35 NY 39 36 OH 29 37 OK 61 38 OR 25 39 PA 34 40 RI 18 41 SC 51 42 SD 32 43 TN 59 44 TX 41 45 UT 22. 46 VA 47 VT 20 12 48 WA 29 49 W 50 W 28 30 51 WY
Step by Step Solution
There are 3 Steps involved in it
Step: 1

Get Instant Access to Expert-Tailored Solutions
See step-by-step solutions with expert insights and AI powered tools for academic success
Step: 2

Step: 3

Ace Your Homework with AI
Get the answers you need in no time with our AI-driven, step-by-step assistance
Get Started


