Answered step by step
Verified Expert Solution
Question
1 Approved Answer
For the 2 CSV files, please email me: mjong at terpmail dot umd dot edu. It won't let me attach here. Overview: In this week,


For the 2 CSV files, please email me: mjong at terpmail dot umd dot edu. It won't let me attach here.
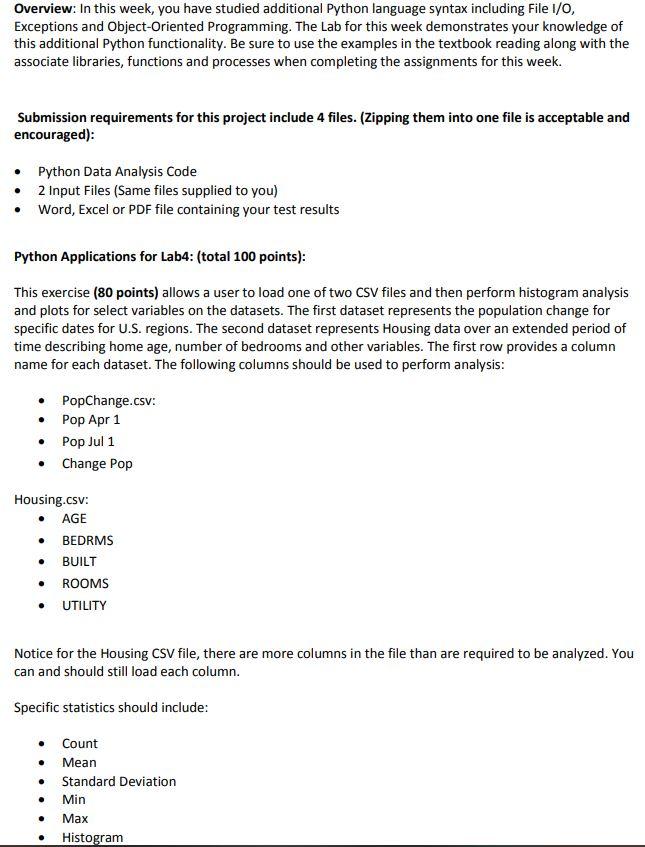
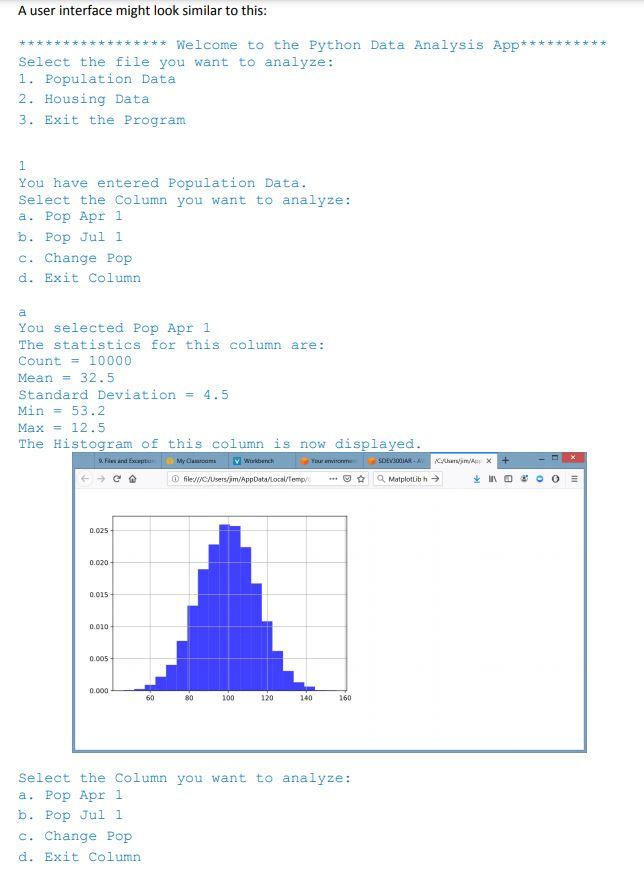
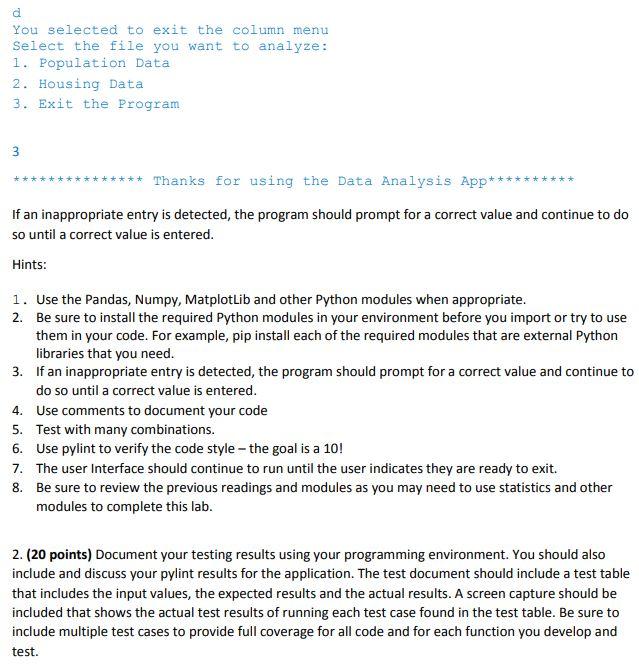
Overview: In this week, you have studied additional Python language syntax including File I/O, Exceptions and Object-Oriented Programming. The Lab for this week demonstrates your knowledge of this additional Python functionality. Be sure to use the examples in the textbook reading along with the associate libraries, functions and processes when completing the assignments for this week. Submission requirements for this project include 4 files. (Zipping them into one file is acceptable and encouraged): Python Data Analysis Code 2 Input Files (Same files supplied to you) Word, Excel or PDF file containing your test results Python Applications for Lab4: (total 100 points): This exercise (80 points) allows a user to load one of two CSV files and then perform histogram analysis and plots for select variables on the datasets. The first dataset represents the population change for specific dates for U.S. regions. The second dataset represents Housing data over an extended period of time describing home age, number of bedrooms and other variables. The first row provides a column name for each dataset. The following columns should be used to perform analysis: . . PopChange.csv: Pop Apr 1 Pop Jul 1 Change Pop . . Housing.csv: AGE . BEDRMS BUILT ROOMS UTILITY . . Notice for the Housing CSV file, there are more columns in the file than are required to be analyzed. You can and should still load each column. Specific statistics should include: . Count Mean Standard Deviation Min Max Histogram . . . A user interface might look similar to this: *** Welcome to the Python Data Analysis App* Select the file you want to analyze: 1. Population Data 2. Housing Data 3. Exit the Program 1 You have entered Population Data. Select the Column you want to analyze: a. Pop Apr 1 b. Pop Jul 1 c. Change Pop d. Exit Column a You selected Pop Apr 1 The statistics for this column are: Count = 10000 Mean = 32.5 Standard Deviation = 4.5 Min = 53.2 Max = 12.5 The Histogram of this column is now displayed. My Caucam Wench Chemix file:///C/Users/jmAppData/local/temy MatplotLib h Find + o 111 0.025 0.020 0.015 0.010 0.005 0.000 60 80 100 120 140 160 Select the Column you want to analyze: a. Pop Apr 1 b. Pop Jul 1 c. Change Pop d. Exit Column d You selected to exit the column menu Select the file you want to analyze : 1. Population Data 2. Housing Data 3. Exit the Program 3 Thanks for using the Data Analysis App* If an inappropriate entry is detected, the program should prompt for a correct value and continue to do so until a correct value is entered. Hints: 1. Use the Pandas, Numpy, MatplotLib and other Python modules when appropriate. 2. Be sure to install the required Python modules in your environment before you import or try to use them in your code. For example, pip install each of the required modules that are external Python libraries that you need. 3. If an inappropriate entry is detected, the program should prompt for a correct value and continue to do so until a correct value is entered. 4. Use comments to document your code 5. Test with many combinations. 6. Use pylint to verify the code style - the goal is a 10! 7. The user Interface should continue to run until the user indicates they are ready to exit. 8. Be sure to review the previous readings and modules as you may need to use statistics and other modules to complete this lab. 2. (20 points) Document your testing results using your programming environment. You should also include and discuss your pylint results for the application. The test document should include a test table that includes the input values, the expected results and the actual results. A screen capture should be included that shows the actual test results of running each test case found in the test table. Be sure to include multiple test cases to provide full coverage for all code and for each function you develop and testStep by Step Solution
There are 3 Steps involved in it
Step: 1

Get Instant Access to Expert-Tailored Solutions
See step-by-step solutions with expert insights and AI powered tools for academic success
Step: 2

Step: 3

Ace Your Homework with AI
Get the answers you need in no time with our AI-driven, step-by-step assistance
Get Started


