Answered step by step
Verified Expert Solution
Question
1 Approved Answer
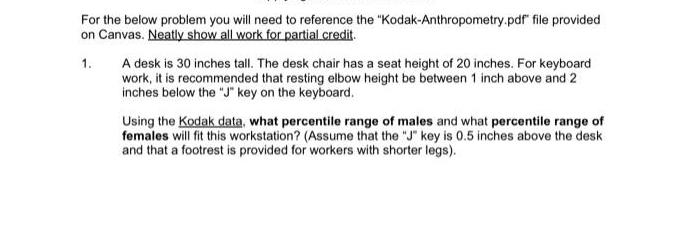
For the below problem you will need to reference the Kodak-Anthropometry.pdf file provided on Canvas. Neatly show all work for partial credit. 1. A


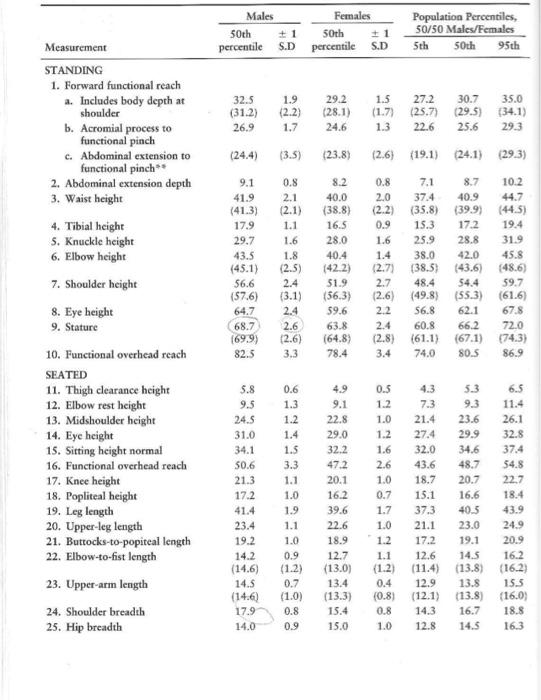
For the below problem you will need to reference the "Kodak-Anthropometry.pdf" file provided on Canvas. Neatly show all work for partial credit. 1. A desk is 30 inches tall. The desk chair has a seat height of 20 inches. For keyboard work, it is recommended that resting elbow height be between 1 inch above and 2 inches below the "J" key on the keyboard. Using the Kodak data, what percentile range of males and what percentile range of females will fit this workstation? (Assume that the "J" key is 0.5 inches above the desk and that a footrest is provided for workers with shorter legs). Measurement STANDING 1. Forward functional reach a. Includes body depth at shoulder b. Acromial process to functional pinch c. Abdominal extension to functional pinch** 2. Abdominal extension depth 3. Waist height 4. Tibial height 5. Knuckle height 6. Elbow height 7. Shoulder height 8. Eye height 9. Stature 10. Functional overhead reach SEATED 11. Thigh clearance height 12. Elbow rest height 13. Midshoulder height 14. Eye height 15. Sitting height normal 16. Functional overhead reach 17. Knee height 18. Popliteal height 19. Leg length 20. Upper-leg length 21. Buttocks-to-popiteal length 22. Elbow-to-fist length 23. Upper-arm length 24. Shoulder breadth 25. Hip breadth Males 50th 1 percentile S.D 32.5 (31.2) 26.9 (24.4) 9.1 41.9 (41.3) 17.9 29.7 43.5 (45.1) 56.6 (57.6) 64.7 68.7 (69.9) 82.5 5.8 9.5 24.5 31.0 34.1 50.6 21.3 17.2 41.4 23.4 19.2 14.2 (14.6) 14.5 (14.6) 17.9 14.0 1.9 (2.2) 1.7 Females 2.6 (2.6) 3.3 50th 1 percentile S.D (3.5) (23.8) 0.6 1.3 1.2 29.2 (28.1) 24.6 0.8 2.1 (2.1) 1.1 1.6 1.8 (2.5) 2.4 51.9 (3.1) (56.3) 2.4 59.6 40.4 (42.2) 63.8 (64.8) 78.4 4.9 9.1 22.8 29.0 32.2 47.2 20.1 16.2 8.2 0.8 7.1 40.0 2.0 37.4 (38.8) (2.2) (35.8) 16.5 0.9 15.3 28.0 1.6 25.9 1.4 38.0 (2.7) (38.5) 1.4 1.5 3.3 1.1 1.0 1.9 1.1 1.0 0.9 (1.2) 0.7 (1.0) (13.3) 0.8 15.4 0.9 15.0 39.6 22.6 1.5 (1.7) 18.9 12.7 (13.0) 13.4 27.2 30.7 35.0 (25.7) (29.5) (34.1) 1.3 22.6 25.6 29.3 Population Percentiles, 50/50 Males/Females 5th 50th 95th (24.1) (29.3) 8.7 40.9 (39.9) 17.2 28.8 42.0 (43.6) 2.7 48.4 54.4 (2.6) (49.8) (55.3) 2.2 56.8 62.1 (2.6) (19.1) 2.4 60.8 66.2 (2.8) (61.1) (67.1) 3.4 74.0 80.5 0.5 1.2 4.3 5.3 7.3 9.3 1.0 21.4 23.6 1.2 27.4 29.9 1.6 32.0 34.6 48.7 18.7 20.7 2.6 43.6 1.0 0.7 15.1 16.6 1.7 37.3 40.5 1.0 21.1 23.0 1.2 17.2 19.1 1.1 12.6 14.5 (1.2) (11.4) (13.8) 0.4 12.9 (0.8) (12.1) 0.8 1.0 13.8 (13.8) 14.3 16.7 12.8 14.5 10.2 44.7 (44.5) 19.4 31.9 45.8 (48.6) 59.7 (61.6) 67.8 72.0 (74.3) 86.9 6.5 11.4 26.1 32.8 37.4 54.8 22.7 18.4 43.9 24.9 20.9 16.2 (16.2) 15.5 (16.0) 18.8 16.3
Step by Step Solution
★★★★★
3.40 Rating (156 Votes )
There are 3 Steps involved in it
Step: 1
To find the percentile range for males and females that will fit the workstation we need to consider ...
Get Instant Access to Expert-Tailored Solutions
See step-by-step solutions with expert insights and AI powered tools for academic success
Step: 2

Step: 3

Ace Your Homework with AI
Get the answers you need in no time with our AI-driven, step-by-step assistance
Get Started


