

Question
For the Blood smear data you collected and explored in Project 1, a. Perform an appropriate t-test to compare the mean cell lengths of the
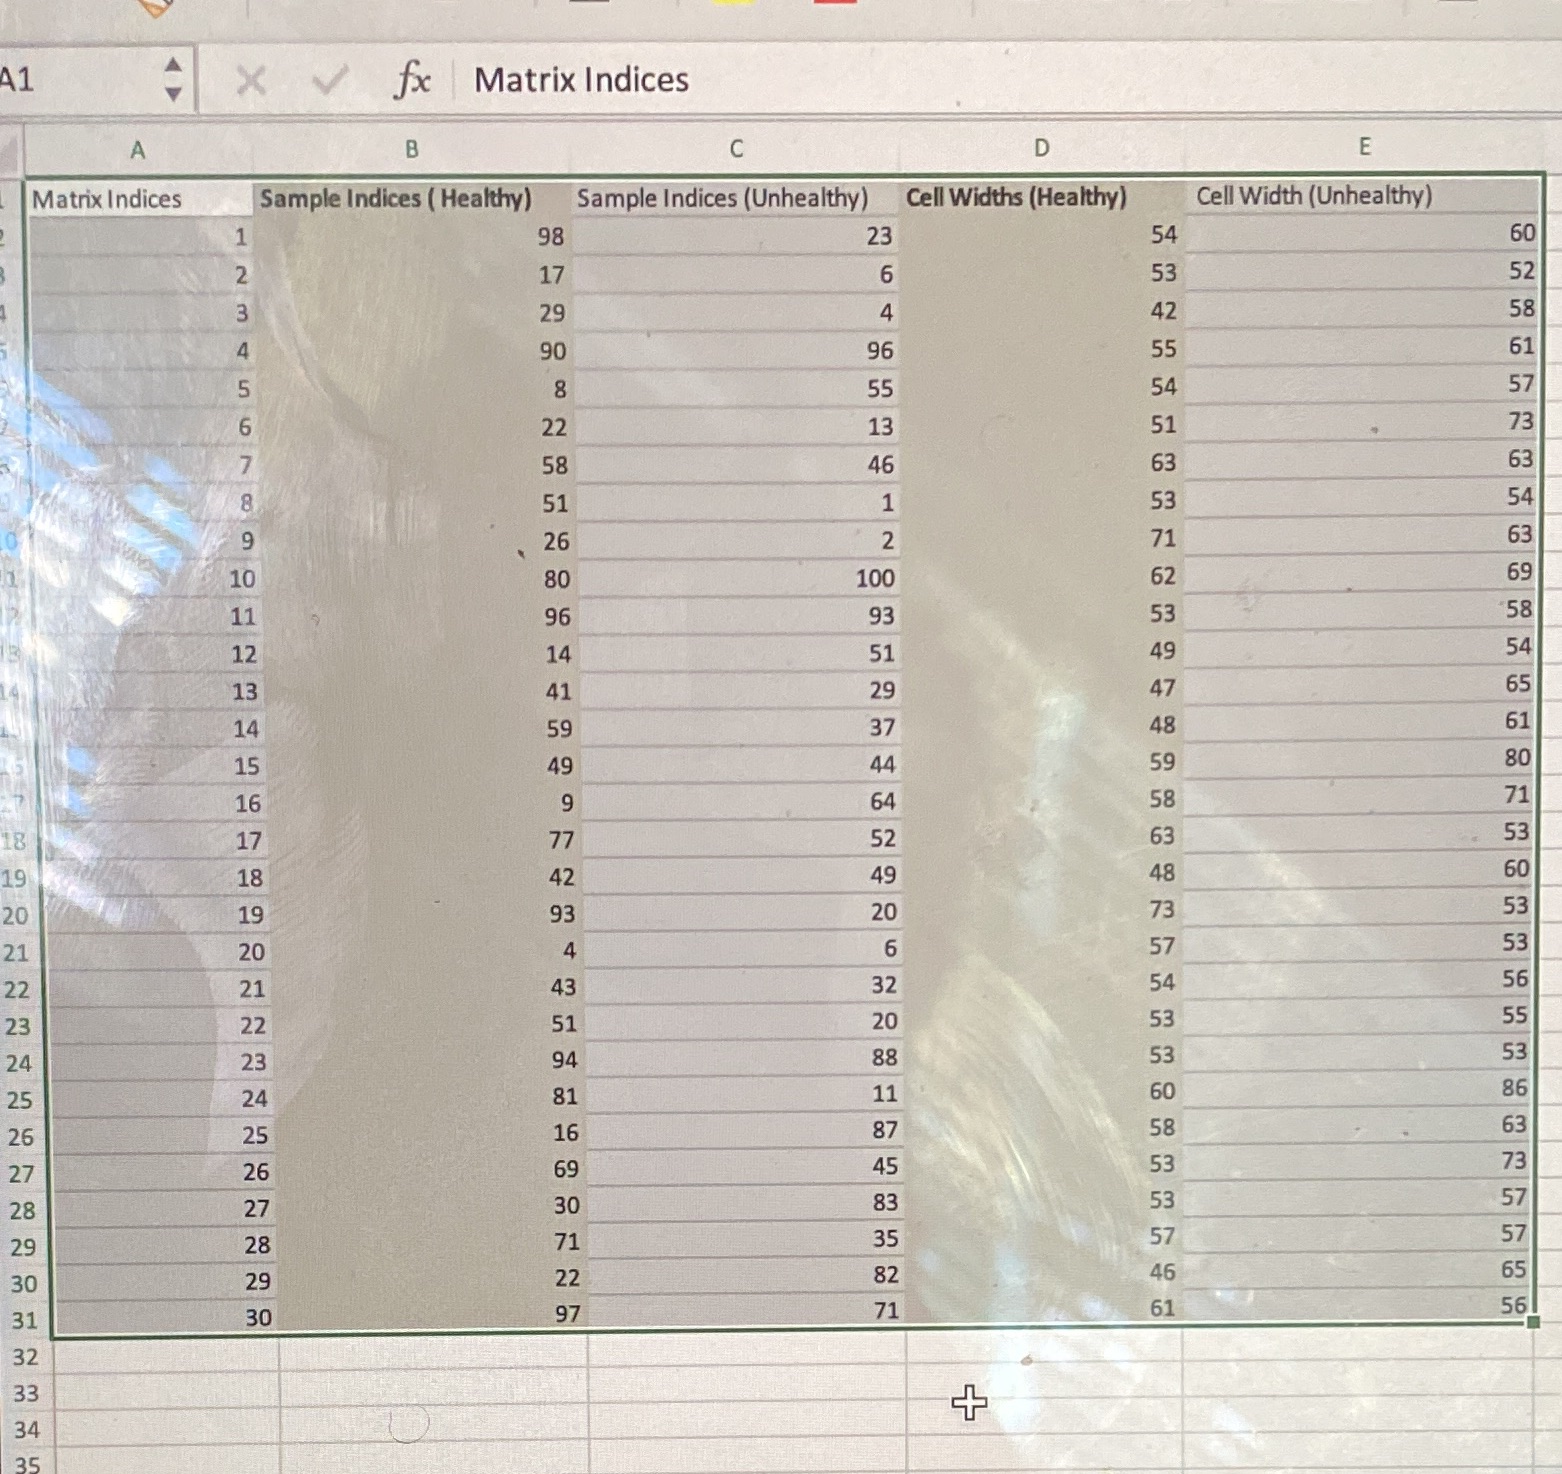
For the Blood smear data you collected and explored in Project 1, a. Perform an appropriate t-test to compare the mean cell lengths of the diseased and the healthy groups using Microsoft Excel. Use ? = 0.05.
What is the appropriate t-test to use for this question?
Step by Step Solution
There are 3 Steps involved in it
Step: 1

Get Instant Access to Expert-Tailored Solutions
See step-by-step solutions with expert insights and AI powered tools for academic success
Step: 2

Step: 3
Ace Your Homework with AI
Get the answers you need in no time with our AI-driven, step-by-step assistance
Get Started
Calculus I With Integrated Precalculus
Authors: Laura Taalman
1st Edition
1464153027, 9781464153020