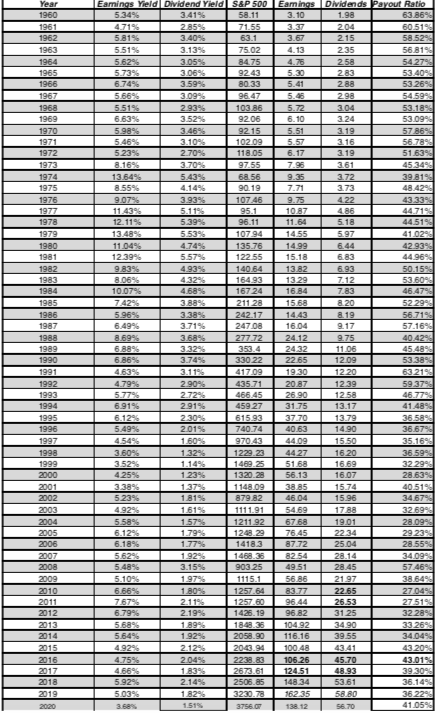
For the calculation, assume the dividends are paid out at once at the end of the year. Answer the following questions with the chart provided.
a. What is your best estimate for next year's HPR?
b. What would have been the annual HPR if you invested in January 1960 and sold at the end of 2020?
c. Which year saw the lowest return? What happened?
d. Starting with an investment in the year after the lowest annual return on record, what would have been the total return over the subsequent 5 years?
e. What is the annual HPR for the 5-year investment starting the year after the lowest return year?
14.55 13.82 Year 1960 1961 1962 1963 1964 1965 1966 1967 1968 1969 1970 1971 1972 1973 1974 1975 1976 1977 1978 1979 1980 1981 1982 1983 1984 1985 1986 1987 1988 1989 1990 1991 1992 1993 1994 1995 1996 1997 1998 1999 2000 2001 2002 2003 2004 2005 2006 2007 2008 2009 2010 2011 2012 2013 2014 2015 2016 2017 2018 2019 2020 Eamings Yield Dividend Yield S&P 500 5.34% 3.41% 58.11 4.71% 2.85% 71.55 5.81% 3.40% 63.1 5.51% 3.13% 75.02 5.5296 3.05% 84.75 5.73% 9243 6.74% 3.59% 80.33 5.66% 96 47 5.51% 2.93% 103.86 6.63% 3.52% 9206 5.9898 3.46% 9215 5.46% 3.10% 102.09 5.23% 2.70% 118.05 8.16% 3.70% 97.55 13.54% 5.43% 68.56 8.55% 4.14% 90.19 9.07% 3.93 107.46 11.43% 5.11% 95.1 12.11% 5.39% 96.11 13.48% 5.53% 107.94 4.74% 135.76 12.39% 5.57% 122.55 49395 140.64 8.06% 4329 16493 10.07% 4.68% 16724 7.42% 211 28 5.969 338% 242.17 6.49% 3.71% 24708 8.69% 3.68% 277.72 6.88% 3.32% 353.4 6.86% 3.74% 330 22 4.63% 3.1195 417.09 4.79% 2.90% 435.71 5.775 2.72 466.45 6.91% 291% 45927 6.12 230% 615 93 5.49% 2.01% 740.74 45495 1-60% 97043 3.60% 13296 1229.23 3.52% 1.14% 1469.25 425% 123% 1320.28 338% 1.37% 1148.09 5.23% 1.81% 879.82 4.92 1.61% 1111.91 5.58% 1.5795 1211.92 6.12% 1.79% 1248.29 6.18% 1.77% 1418.3 5.62% 1.929 1468.35 5.48% 3.15% 903 25 5.10% 1.97% 1115.1 6.66% 1.80% 1257.64 7.67% 2.11% 1257.60 6.79% 2.19% 1426.19 5.68% 1.89% 1848.36 5.64% 1.92% 2058.90 4.92% 2.12% 2043.94 4.75% 2.04% 2238.83 4.66% 2673.61 5.92% 2.14% 2505.85 5.03% 1.82% 3230.78 3.68% 1.51% 3756.07 Eam ings Dividends Payout Ratio 3.10 1.98 63.86% 204 60 5190 215 58.52% 4.13 2.35 56.8198 4.76 2.58 542796 5.30 283 53.400 5.41 2.88 53 26% 5.46 298 54.59% 5.72 3.04 53.1899 6.10 3.24 53.09% 5.51 3.19 57869 5.57 3.16 56.7890 6.17 3.19 51.63% 7.96 3.61 45 34 9.35 3.72 39.816 7.71 3.73 48.42% 9.75 4.22 43.3396 10.87 4.86 44.7196 11.64 5.18 44 519 597 41.0298 14.99 6.44 42.939 15.18 6.83 44.9696 6.93 50.1596 1329 7.12 53.60 16.84 7.83 46.47% 15.68 8. 20 5229 14.43 8.19 56.7198 16.04 9.17 57.169 24.12 9.75 40.4245 2432 11.06 45.48% 22.65 12.09 53 38% 1930 12.20 63 21% 20.87 1239 59 379 25.90 12.58 46.77 31.75 13.17 41.488 37.70 13.79 36.589 40.63 14.90 36.679 44.09 15.50 35.16 4427 16 20 36.599 51.68 16.69 32294 56.13 16.07 28.639 38.85 15.74 405193 46.04 15.96 34.6796 54.69 1788 32.699 67.68 19.01 28.0996 76.45 2234 2923 8772 25.04 28.55% 82.54 28.14 3409 49.51 28.45 57.46% 56.36 2197 38.6490 83.77 22.65 27.04% 96.44 25.53 27 5190 96.82 3125 32.2896 104.92 34.90 33 262 116.16 39.55 34.0498 100.48 43.41 43 20 106.26 45.70 124.51 48.93 39 30 148.34 53.61 36.14% 162.35 58.80 36 22 138.12 56.70 41.05% 14.55 13.82 Year 1960 1961 1962 1963 1964 1965 1966 1967 1968 1969 1970 1971 1972 1973 1974 1975 1976 1977 1978 1979 1980 1981 1982 1983 1984 1985 1986 1987 1988 1989 1990 1991 1992 1993 1994 1995 1996 1997 1998 1999 2000 2001 2002 2003 2004 2005 2006 2007 2008 2009 2010 2011 2012 2013 2014 2015 2016 2017 2018 2019 2020 Eamings Yield Dividend Yield S&P 500 5.34% 3.41% 58.11 4.71% 2.85% 71.55 5.81% 3.40% 63.1 5.51% 3.13% 75.02 5.5296 3.05% 84.75 5.73% 9243 6.74% 3.59% 80.33 5.66% 96 47 5.51% 2.93% 103.86 6.63% 3.52% 9206 5.9898 3.46% 9215 5.46% 3.10% 102.09 5.23% 2.70% 118.05 8.16% 3.70% 97.55 13.54% 5.43% 68.56 8.55% 4.14% 90.19 9.07% 3.93 107.46 11.43% 5.11% 95.1 12.11% 5.39% 96.11 13.48% 5.53% 107.94 4.74% 135.76 12.39% 5.57% 122.55 49395 140.64 8.06% 4329 16493 10.07% 4.68% 16724 7.42% 211 28 5.969 338% 242.17 6.49% 3.71% 24708 8.69% 3.68% 277.72 6.88% 3.32% 353.4 6.86% 3.74% 330 22 4.63% 3.1195 417.09 4.79% 2.90% 435.71 5.775 2.72 466.45 6.91% 291% 45927 6.12 230% 615 93 5.49% 2.01% 740.74 45495 1-60% 97043 3.60% 13296 1229.23 3.52% 1.14% 1469.25 425% 123% 1320.28 338% 1.37% 1148.09 5.23% 1.81% 879.82 4.92 1.61% 1111.91 5.58% 1.5795 1211.92 6.12% 1.79% 1248.29 6.18% 1.77% 1418.3 5.62% 1.929 1468.35 5.48% 3.15% 903 25 5.10% 1.97% 1115.1 6.66% 1.80% 1257.64 7.67% 2.11% 1257.60 6.79% 2.19% 1426.19 5.68% 1.89% 1848.36 5.64% 1.92% 2058.90 4.92% 2.12% 2043.94 4.75% 2.04% 2238.83 4.66% 2673.61 5.92% 2.14% 2505.85 5.03% 1.82% 3230.78 3.68% 1.51% 3756.07 Eam ings Dividends Payout Ratio 3.10 1.98 63.86% 204 60 5190 215 58.52% 4.13 2.35 56.8198 4.76 2.58 542796 5.30 283 53.400 5.41 2.88 53 26% 5.46 298 54.59% 5.72 3.04 53.1899 6.10 3.24 53.09% 5.51 3.19 57869 5.57 3.16 56.7890 6.17 3.19 51.63% 7.96 3.61 45 34 9.35 3.72 39.816 7.71 3.73 48.42% 9.75 4.22 43.3396 10.87 4.86 44.7196 11.64 5.18 44 519 597 41.0298 14.99 6.44 42.939 15.18 6.83 44.9696 6.93 50.1596 1329 7.12 53.60 16.84 7.83 46.47% 15.68 8. 20 5229 14.43 8.19 56.7198 16.04 9.17 57.169 24.12 9.75 40.4245 2432 11.06 45.48% 22.65 12.09 53 38% 1930 12.20 63 21% 20.87 1239 59 379 25.90 12.58 46.77 31.75 13.17 41.488 37.70 13.79 36.589 40.63 14.90 36.679 44.09 15.50 35.16 4427 16 20 36.599 51.68 16.69 32294 56.13 16.07 28.639 38.85 15.74 405193 46.04 15.96 34.6796 54.69 1788 32.699 67.68 19.01 28.0996 76.45 2234 2923 8772 25.04 28.55% 82.54 28.14 3409 49.51 28.45 57.46% 56.36 2197 38.6490 83.77 22.65 27.04% 96.44 25.53 27 5190 96.82 3125 32.2896 104.92 34.90 33 262 116.16 39.55 34.0498 100.48 43.41 43 20 106.26 45.70 124.51 48.93 39 30 148.34 53.61 36.14% 162.35 58.80 36 22 138.12 56.70 41.05%