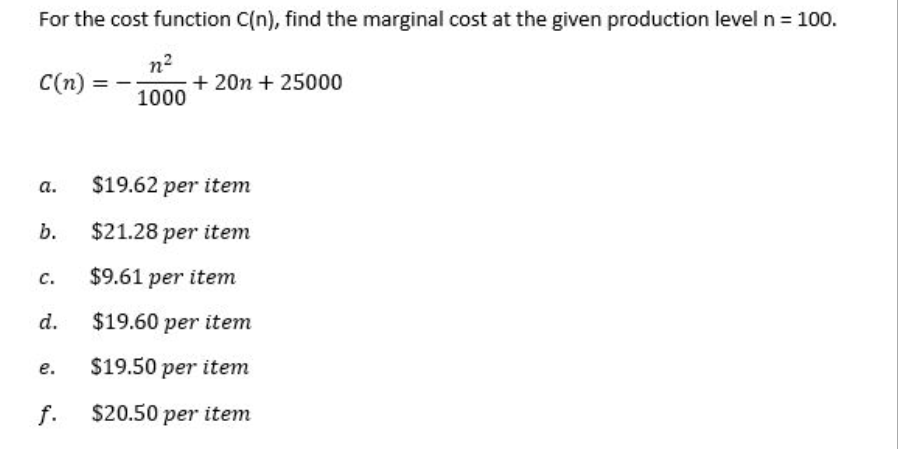
For the cost function C(n), find the marginal cost at the given production level n = 100. n2 C(n) = - + 20n + 25000
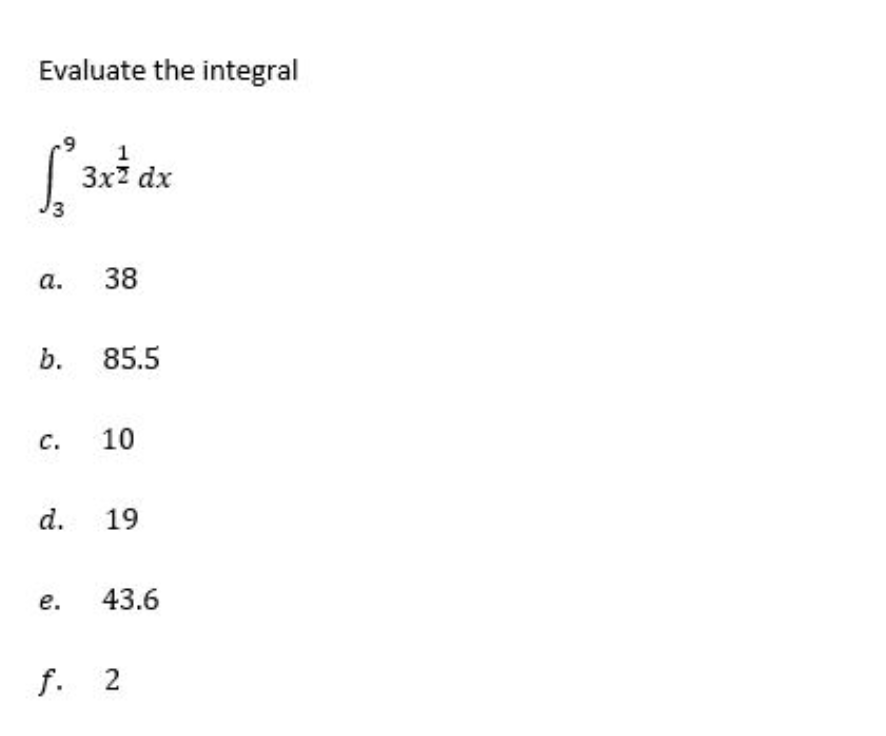
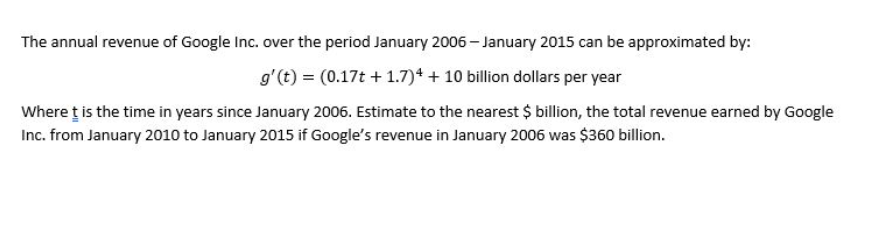
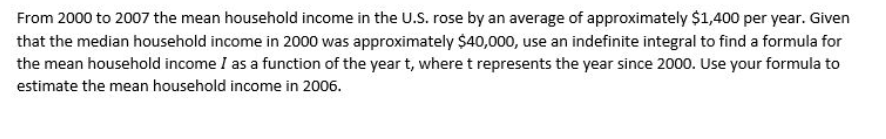
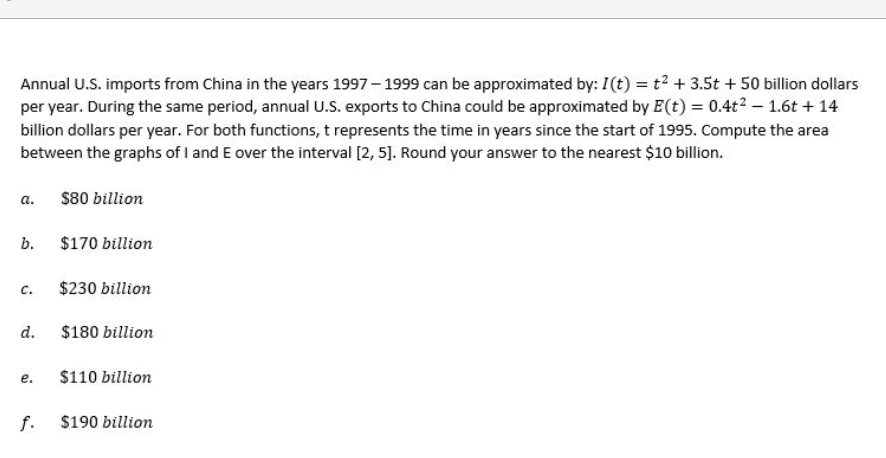
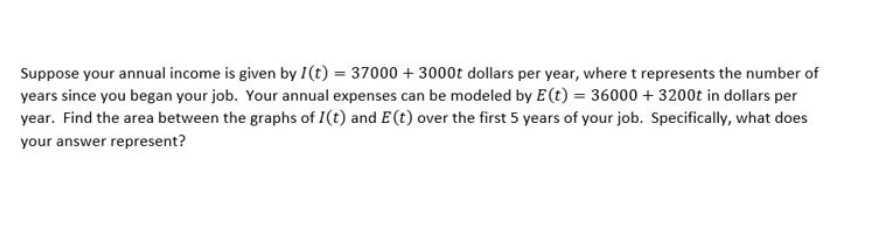
For the cost function C(n), find the marginal cost at the given production level n = 100. n2 C(n) = - + 20n + 25000 1000 a. $19.62 per item b. $21.28 per item c. $9.61 per item d. $19.60 per item e. $19.50 per item f. $20.50 per item Evaluate the integral 3x2 dx 3 a. 38 b. 85.5 C. 10 d. 19 e. 43.6 f. 2Annual U.S. imports from China in the years 1997 - 1999 can be approximated by: I (t) = t + 3.5t + 50 billion dollars per year. During the same period, annual U.S. exports to China could be approximated by E(t) = 0.4t2 - 1.6t + 14 billion dollars per year. For both functions, t represents the time in years since the start of 1995. Compute the area between the graphs of I and E over the interval [2, 5]. Round your answer to the nearest $10 billion. a. $80 billion b. $170 billion c. $230 billion d. $180 billion e. $110 billion f. $190 billionThe annual revenue of Google Inc. over the period January 2006 - January 2015 can be approximated by: g'(t) = (0.17t + 1.7)# + 10 billion dollars per year Where t is the time in years since January 2006. Estimate to the nearest $ billion, the total revenue earned by Google Inc. from January 2010 to January 2015 if Google's revenue in January 2006 was $360 billion.Suppose your annual income is given by I (t) = 37000 + 3000t dollars per year, where t represents the number of years since you began your job. Your annual expenses can be modeled by E (t) = 36000 + 3200t in dollars per year. Find the area between the graphs of I(t) and E(t) over the first 5 years of your job. Specifically, what does your answer represent?From 2600 to 200? the mean household income in the [1.5. rose by an average of approximately.r $1,400 per year. Given that the median household income in 2000 was approximately $40,000, use an indefinite integral to nd a formula for the mean household income I as a function of the year t, where t represents the year since 2000. Use your formula to estimate the mean household income in 2006. Revenue from the sale of new homes in the U3. decreased dramatically from 2005 to 2010. The rate of revenue for this time period can be approximated by r'(t) = 4129-1133:: billion dollars per year Where ; is the veer since 2005. If this trend were to continue into the indenite future, estimate the total revenue from the sale of new homes in the U.S. from 2005 on. [Round your answer to the nearest $0.1 billion
Step by Step Solution
There are 3 Steps involved in it
Step: 1
Get Instant Access to Expert-Tailored Solutions
See step-by-step solutions with expert insights and AI powered tools for academic success
Step: 2
Step: 3
Ace Your Homework with AI
Get the answers you need in no time with our AI-driven, step-by-step assistance