Answered step by step
Verified Expert Solution
Question
1 Approved Answer
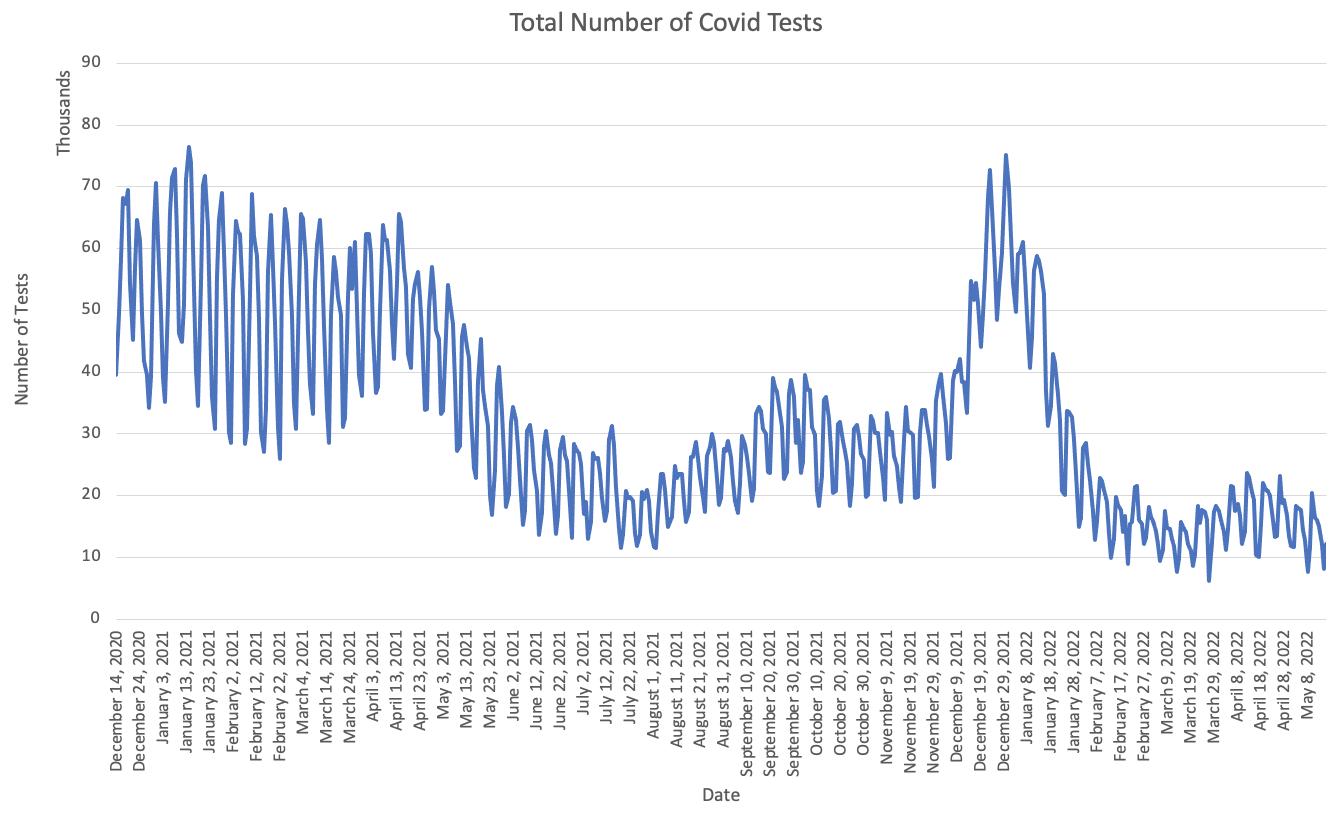
For the following graph, answer the following: mean, median, a mode for the central tendency; st. deviation, variance, range, IQR, Quartiles for a spread of
For the following graph, answer the following: mean, median, a mode for the central tendency; st. deviation, variance, range, IQR, Quartiles for a spread of data; Equation of LOBF/ COBF, r, R^2 for characteristics of a trend model and how well it suits a set of data; cause-and-effect relations from scatter plots.
Include the equation for the line/curve of best fit. You can analyze different models: linear, quadratic, exponential, polynomial, etc.
Date December 14, 2020 December 24, 2020 January 3, 2021 January 13, 2021 January 23, 2021 February 2, 2021 February 12, 2021 February 22, 2021 March 4, 2021 March 14, 2021 March 24, 2021 April 3, 2021 April 13, 2021 April 23, 2021 May 3, 2021 May 13, 2021 May 23, 2021 June 2, 2021 June 12, 2021 June 22, 2021 July 2, 2021 July 12, 2021 July 22, 2021 August 1, 2021 August 11, 2021 August 21, 2021 August 31, 2021 September 10, 2021 September 20, 2021 September 30, 2021 October 10, 2021 October 20, 2021 October 30, 2021 November 9, 2021 November 19, 2021 November 29, 2021 December 9, 2021 December 19, 2021 December 29, 2021 January 8, 2022 January 18, 2022 January 28, 2022 February 7, 2022 February 17, 2022 February 27, 2022 March 9, 2022 March 19, 2022 March 29, 2022 April 8, 2022 April 18, 2022 April 28, 2022 May 8, 2022 0 10 20 30 Number of Tests 20 50 60 70 Thousands 90 Total Number of Covid Tests
Step by Step Solution
★★★★★
3.45 Rating (161 Votes )
There are 3 Steps involved in it
Step: 1
Answer Step 1 Mean A measure of central tendency for a data set such that the entire observations in the data set tend to cluster around it Median A measure of central tendency such that onehalf of th...
Get Instant Access to Expert-Tailored Solutions
See step-by-step solutions with expert insights and AI powered tools for academic success
Step: 2

Step: 3

Ace Your Homework with AI
Get the answers you need in no time with our AI-driven, step-by-step assistance
Get Started


