Answered step by step
Verified Expert Solution
Question
1 Approved Answer
For the following program (i.e conway's game of life) write the syntax (Matlab) to plot a graph of the dots as a function of time
For the following program (i.e conway's game of life) write the syntax (Matlab) to plot a graph of the dots as a function of time and also to find the standard deviation and average of the dots per trial. The hint is given below on how to do that.

function game(n,m,t)
B = round(rand(n,m)); for time=1:t A = B; for i=1:n for j=1:m cola = [i-1,i,i+1]; cola(colan) = 1; colb = [j-1,j,j+1]; colb(colbm) = 1; R=sum(sum(A(cola,colb)));
B(i,j) = ((R==3 || R==4) && A(i,j)) || ( R==3 && ~B(i,j)); end end spy(B); pause(0.05); end
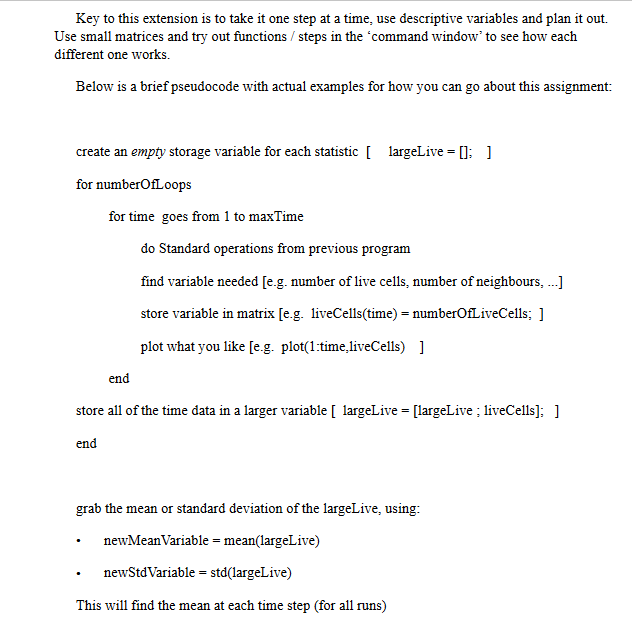
Key to this extension is to take it one step at a time, use descriptive variables and plan it out. Use small matrices and try out functions/steps in the "command window' to see how each different one works Below is a brief pseudocode with actual examples for how you can go about this assignment: create an empty storage variable for each statistic [ largeLive = []; ] for numberOfLoops for time goes from 1 to maxTime do Standard operations from previous progranm find variable needed [e.g. number of live cells, number of neighbours,. store variable in matrix [e.g. liveCells(time) = numberOfLiveCells. ] plot what you like [e.g. plot(1:time,liveCells) ] end store all of the time data in a larger variable [ largeLive = [largeLive ; liveCells]. ] end grab the mean or standard deviation of the largeLive, using newMeanVariable = mean(largelive) newStdVariable = std(largeLive) This will find the mean at each time step (for all runs) Key to this extension is to take it one step at a time, use descriptive variables and plan it out. Use small matrices and try out functions/steps in the "command window' to see how each different one works Below is a brief pseudocode with actual examples for how you can go about this assignment: create an empty storage variable for each statistic [ largeLive = []; ] for numberOfLoops for time goes from 1 to maxTime do Standard operations from previous progranm find variable needed [e.g. number of live cells, number of neighbours,. store variable in matrix [e.g. liveCells(time) = numberOfLiveCells. ] plot what you like [e.g. plot(1:time,liveCells) ] end store all of the time data in a larger variable [ largeLive = [largeLive ; liveCells]. ] end grab the mean or standard deviation of the largeLive, using newMeanVariable = mean(largelive) newStdVariable = std(largeLive) This will find the mean at each time step (for all runs)Step by Step Solution
There are 3 Steps involved in it
Step: 1

Get Instant Access to Expert-Tailored Solutions
See step-by-step solutions with expert insights and AI powered tools for academic success
Step: 2

Step: 3

Ace Your Homework with AI
Get the answers you need in no time with our AI-driven, step-by-step assistance
Get Started


