Question
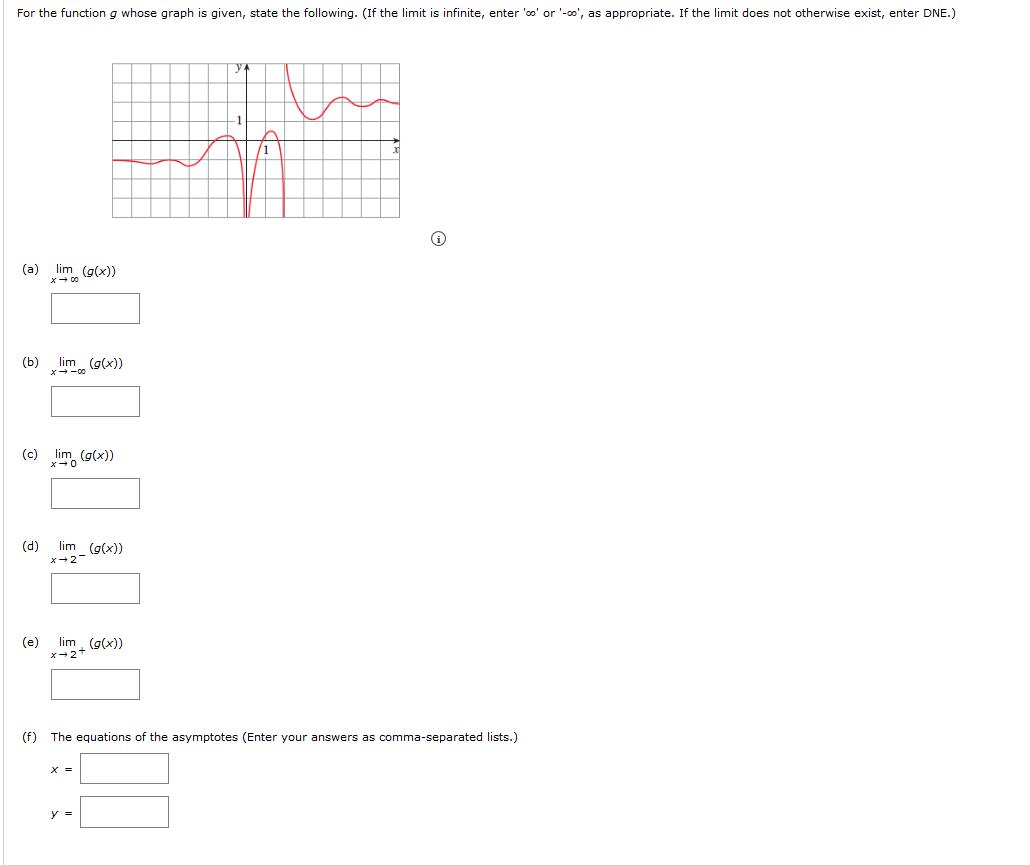
The x-y-coordinate plane is given. The curve enters the window almost horizontally below y = 1, goes to the right oscillating between the y -values
 The x-y-coordinate plane is given. The curve enters the window almost horizontally below y = −1, goes to the right oscillating between the y-values of −1.25 and −0.75, changes direction at the approximate point (−3, −1.25) goes up and right becoming more steep, changes direction at the approximate point (−1, 0.25), goes down and right becoming more steep, exits the window almost vertically just to the left of x = 0, reenters the window almost vertically just to the right of x = 0, goes up and right becoming less steep, changes direction at the approximate point (1.25, 0.5), goes down and right becoming more steep, exits the window almost vertically just to the left of x = 2, reenters the window almost vertically just to the right of x = 2, goes down and right becoming less steep, changes direction at the approximate point (3.5, 1), goes up and right becoming more steep, changes direction at the approximate point (5, 2.25), goes to the right oscillating between the y-values of 2.25 and 1.75, and exits the window nearly horizontally below y = 2.
For the function g whose graph is given, state the following. (If the limit is infinite, enter 'co' or '-co', as appropriate. If the limit does not otherwise exist, enter DNE.) (a) lim (g(x)) x 00 (b) lim (g(x))
Step by Step Solution
3.34 Rating (148 Votes )
There are 3 Steps involved in it
Step: 1
For the given informations of functions we can analyse t...
Get Instant Access to Expert-Tailored Solutions
See step-by-step solutions with expert insights and AI powered tools for academic success
Step: 2

Step: 3

Ace Your Homework with AI
Get the answers you need in no time with our AI-driven, step-by-step assistance
Get Started


