

Question
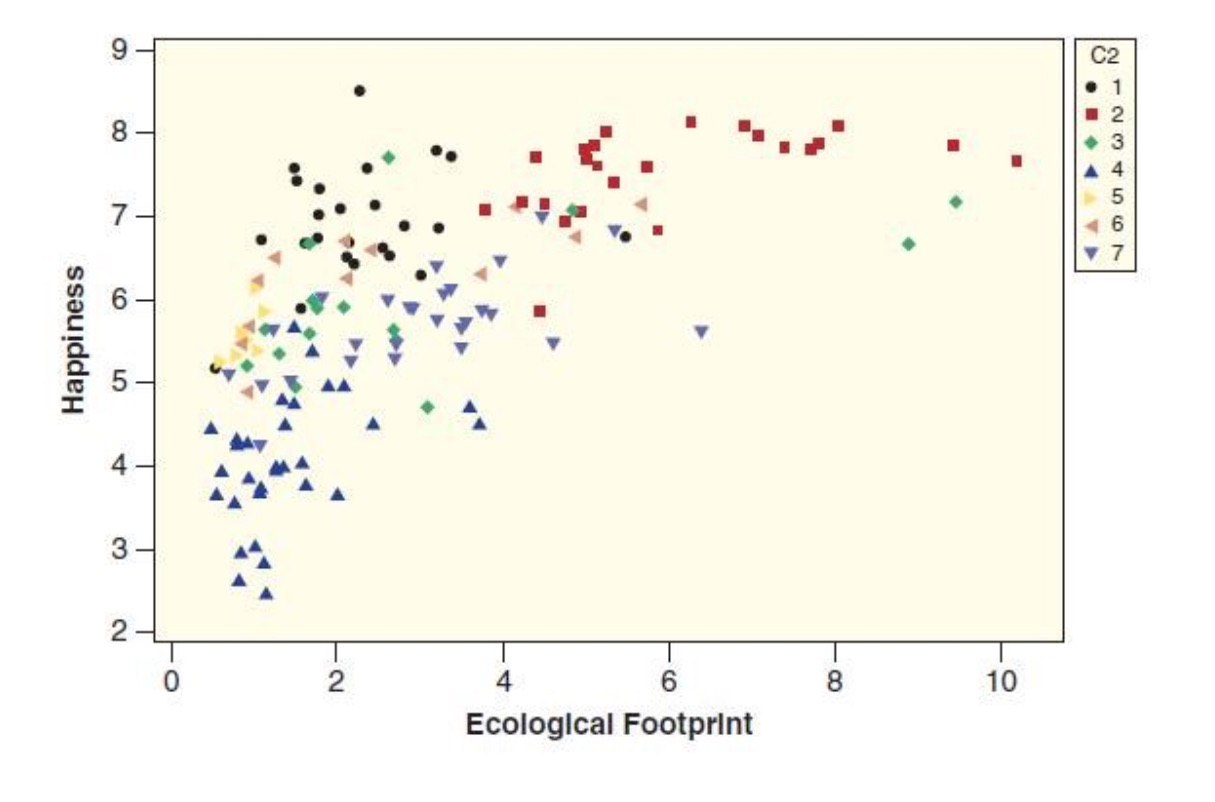
For the graph, interpret what the graph is telling us about happiness and ecological footprint, as described above.Estimate and provide a range (minimum to maximum
For the graph, interpret what the graph is telling us about happiness and ecological footprint, as described above.Estimate and provide a range (minimum to maximum value), with a width no more than 0.2, for where you think the correlation statistic falls and support your decision with an explanation of the data points you see. Note: You are being asked to estimate the correlation statistic, you do not have to calculate the exact value.What could affect the size of the correlation statistic?In regard to the actual data points (hint: what are we assuming about the data?)In regard to how the variables were measured (i.e., what information is used to define them, as well as other potential information not considered?)
Step by Step Solution
There are 3 Steps involved in it
Step: 1

Get Instant Access to Expert-Tailored Solutions
See step-by-step solutions with expert insights and AI powered tools for academic success
Step: 2

Step: 3
Ace Your Homework with AI
Get the answers you need in no time with our AI-driven, step-by-step assistance
Get Started
Elementary Linear Algebra with Applications
Authors: Bernard Kolman, David Hill
9th edition
132296543, 978-0132296540