Answered step by step
Verified Expert Solution
Link Copied!

Question

1 Approved Answer

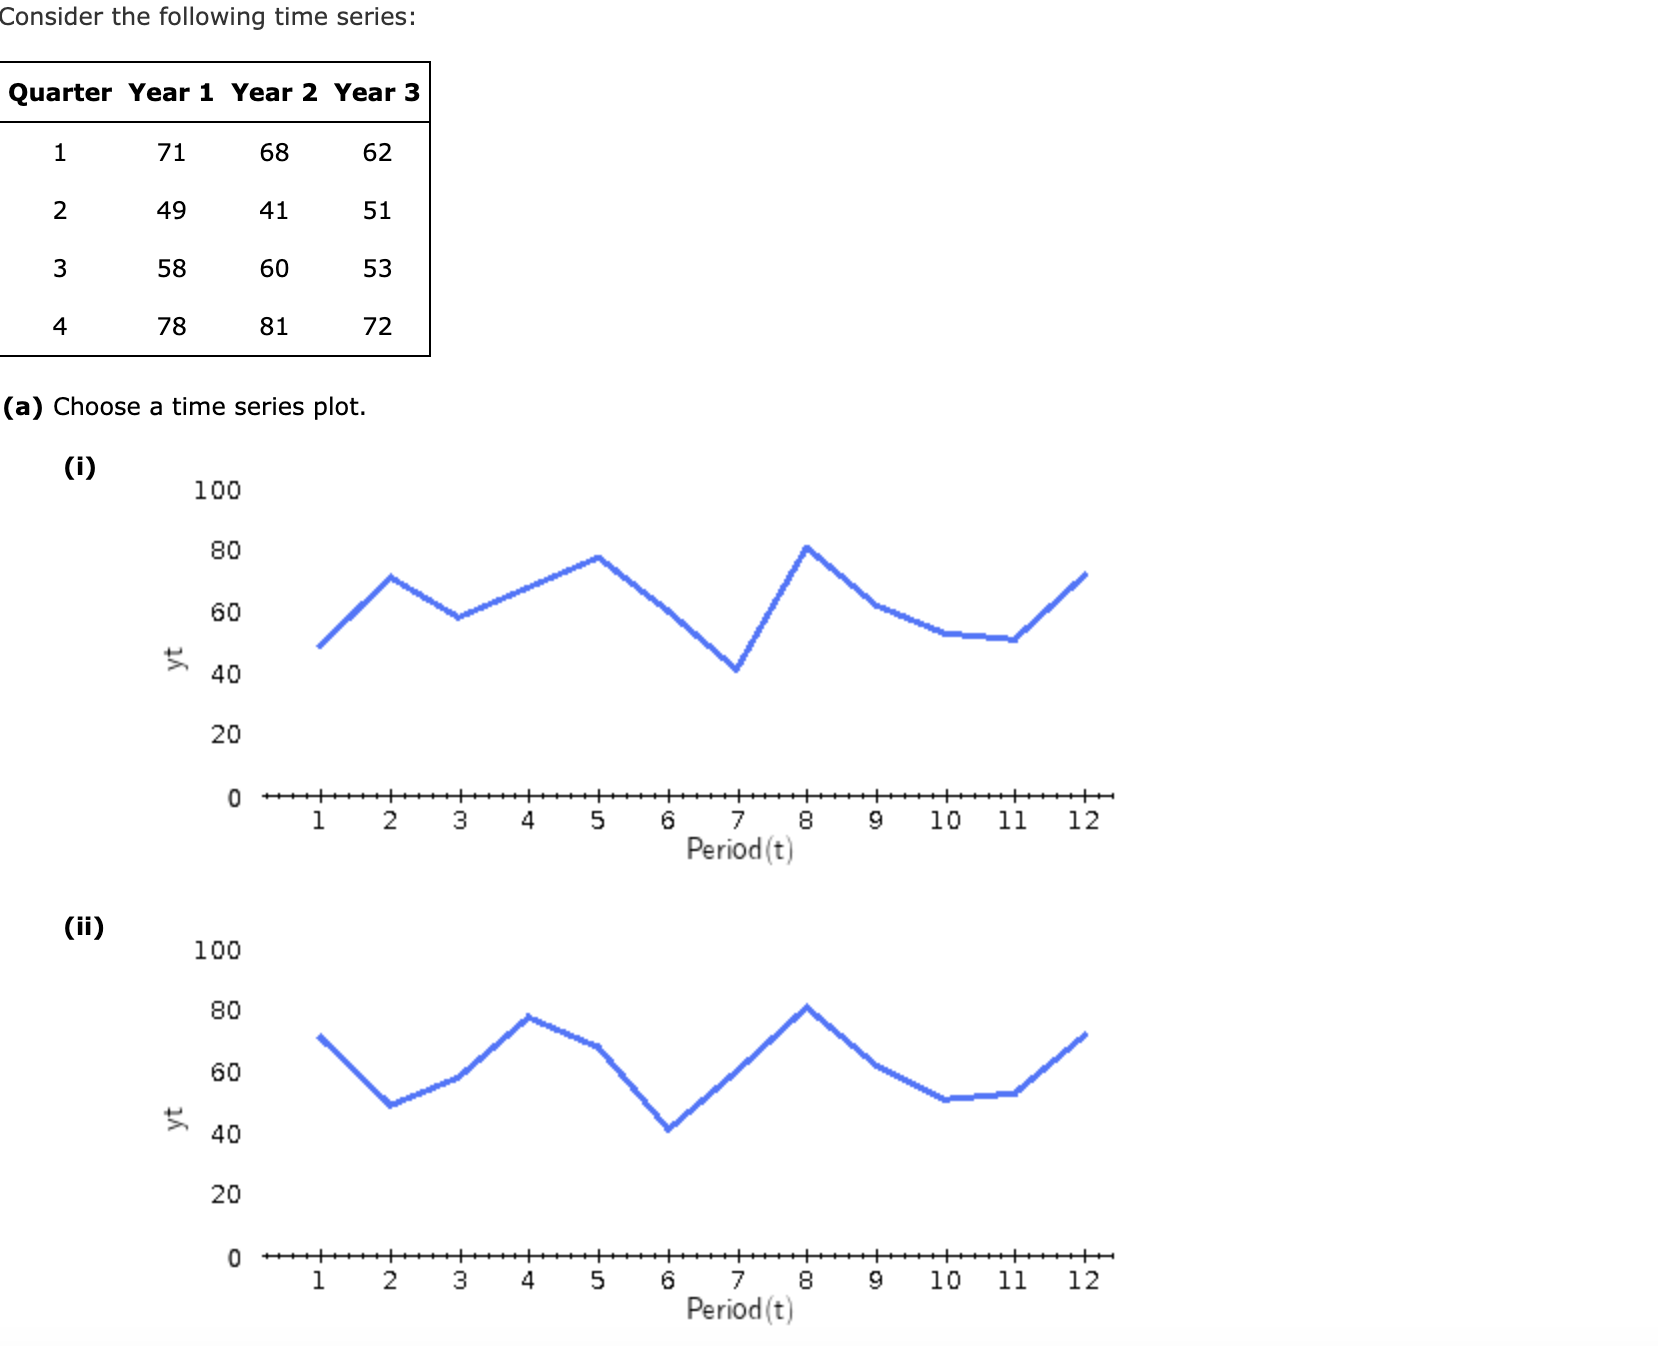
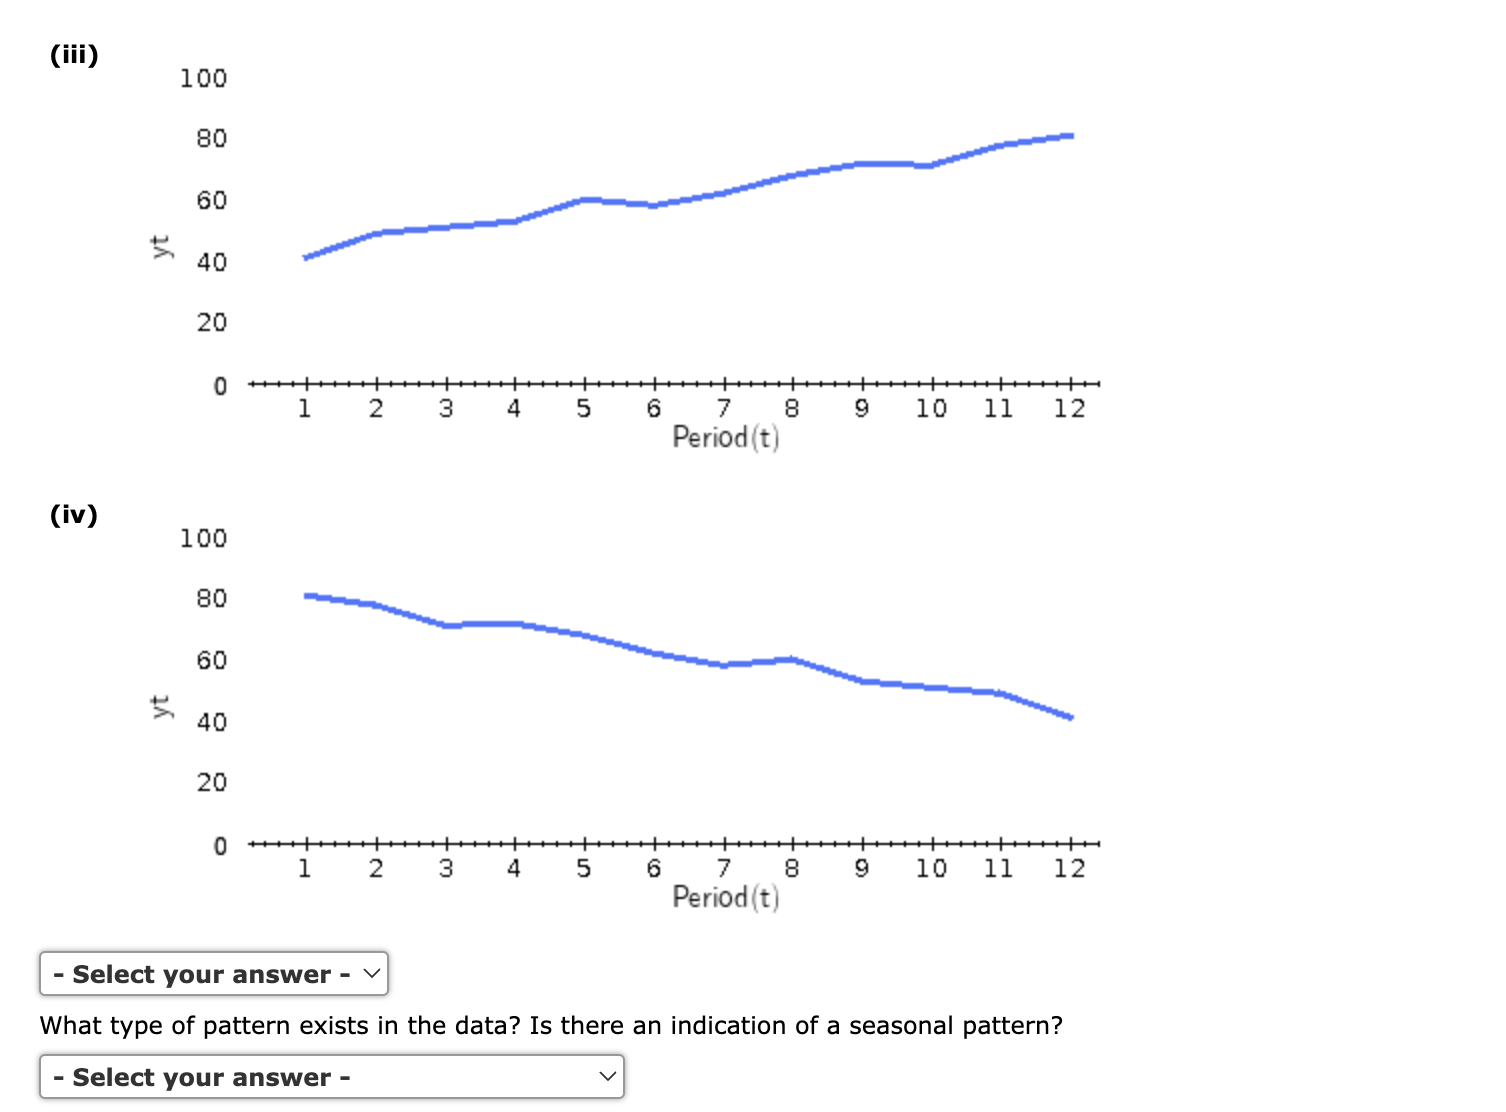
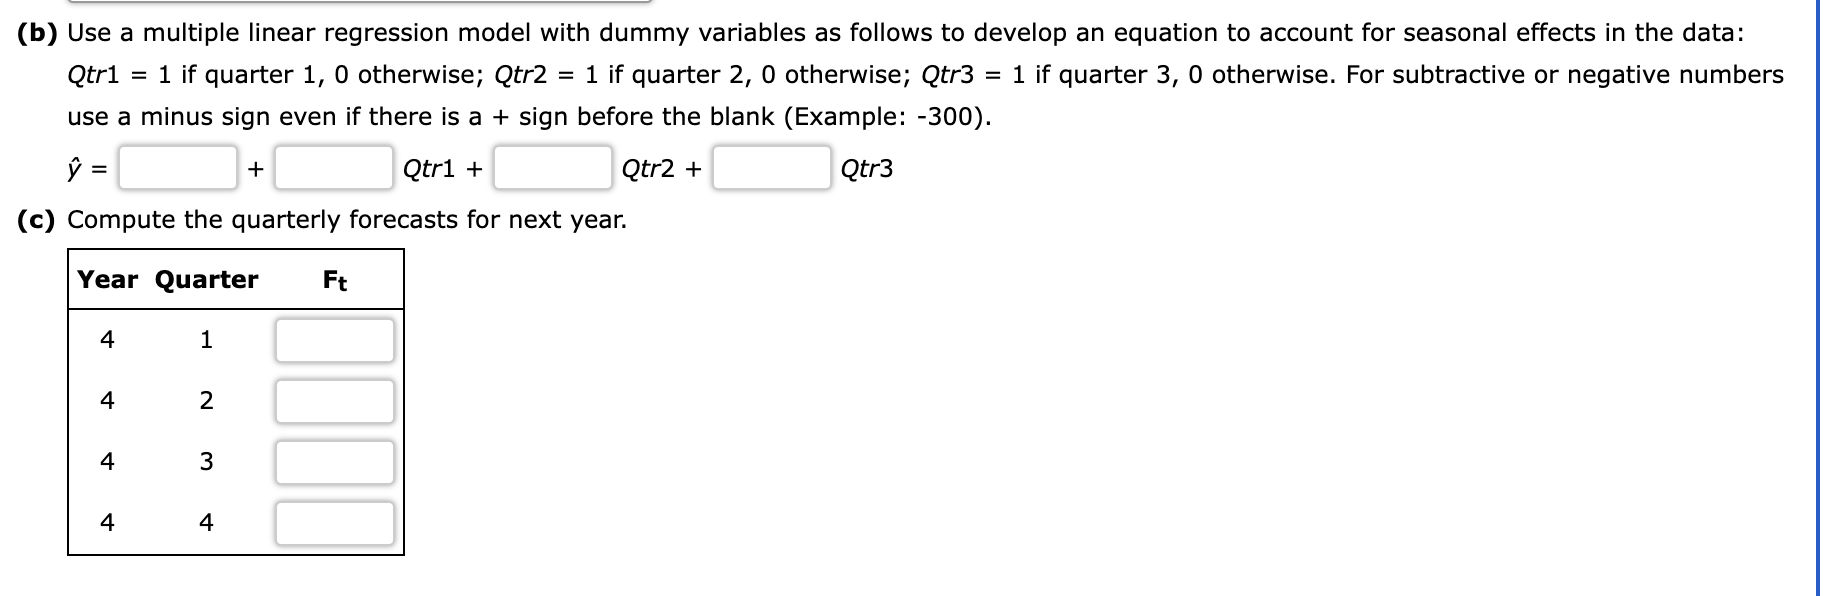
question 4 Consider the following time series: Quarter Year 1 Year 2 Year 3 71 68 62 N 49 41 51 3 58 60 53

question 4

image text in transcribedimage text in transcribedimage text in transcribed
Consider the following time series: Quarter Year 1 Year 2 Year 3 71 68 62 N 49 41 51 3 58 60 53 4 78 81 72 (a) Choose a time series plot. (i) 100 80 60 5 40 20 0 1 2 3 4 5 6 7 8 9 10 11 12 Period (t) (ii) 100 80 60 3 40 20 0 1 2 3 4 5 6 7 8 9 10 11 12 Period (t)(iii) (iv) - Select your answer - v Period(t) Period(t) 8 8 10 10 11 | 12 12 What type of pattern exists in the data? Is there an indication of a seasonal pattern? - Select your answer - v (b) Use a multiple linear regression model with dummy variables as follows to develop an equation to account for seasonal effects in the data: Qtrl = 1 if quarter 1, 0 otherwise; Qtr2 = 1 if quarter 2, 0 otherwise; Qtr3 = 1 if quarter 3, 0 otherwise. For subtractive or negative numbers use a minus sign even if there is a + sign before the blank (Example: -300). y = + Qtrl + Qtr2 + Qtr3 (c) Compute the quarterly forecasts for next year. Year Quarter Ft

Step by Step Solution

There are 3 Steps involved in it

Step: 1

blur-text-image

Get Instant Access to Expert-Tailored Solutions

See step-by-step solutions with expert insights and AI powered tools for academic success

Step: 2

blur-text-image

Step: 3

blur-text-image

Ace Your Homework with AI

Get the answers you need in no time with our AI-driven, step-by-step assistance

Get Started

Recommended Textbook for

More Books

Students also viewed these Mathematics questions