Question
For the next 5 questions, you have been tasked with building a stand-alone DCF valuation for Graham Holdings (GHC), a publicly traded company, using the
For the next 5 questions, you have been tasked with building a stand-alone DCF valuation for Graham Holdings (GHC), a publicly traded company, using the unlevered (two-stage) approach.
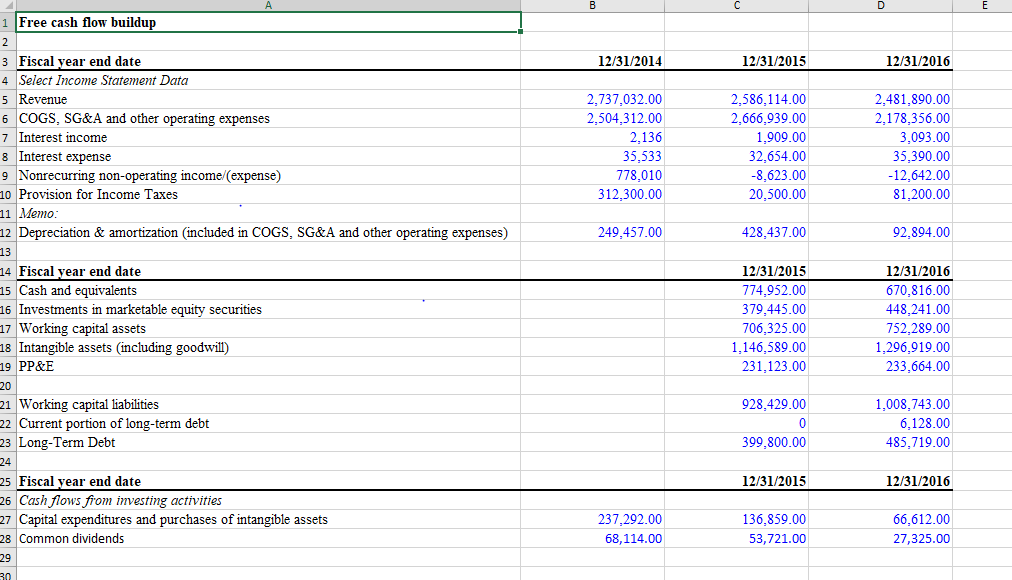
You have collected the data found in this file: GHC Free Cashflow Data (download the file by clicking the link and open it to answer this question).

Question: Using the data from the GHC Free Cashflow Data workbook, calculate 2016 unlevered free cash flows. Assume the tax rate = 2016 tax expense / pretax income.
A) 241,530.0
B) 268,855.0
C) 270,976.7
D) 282,966.0
E) 333,379.0
C 12/31/2014 12/31/2015 12/31/2016 2,737,032.00 2,504,312.00 2,136 35,533 778,010 312,300.00 2,586,114.00 2,666,939.00 1,909.00 32,654.00 -8,623.00 20,500.00 2,481,890.00 2,178,356.00 3,093.00 35,390.00 -12,642.00 81,200.00 249,457.00 428,437.00 92.894.00 1 Free cash flow buildup 2 3 Fiscal year end date 4 Select Income Statement Data 5 Revenue 6 COGS, SG&A and other operating expenses 7 Interest income 8 Interest expense 9 Nonrecurring non-operating income (expense) 10 Provision for Income Taxes 11 Memo: 12 Depreciation & amortization (included in COGS, SG&A and other operating expenses) 13 14 Fiscal year end date 15 Cash and equivalents 16 Investments in marketable equity securities 17 Working capital assets 18 Intangible assets (including goodwill) 19 PP&E 20 21 Working capital liabilities 22 Current portion of long-term debt 23 Long-Term Debt 24 25 Fiscal year end date 26 Cash flows from investing activities 27 Capital expenditures and purchases of intangible assets 28 Common dividends 29 30 12/31/2015 774,952.00 379,445.00 706,325.00 1,146,589.00 231,123.00 12/31/2016 670,816.00 448,241.00 752.289.00 1,296,919.00 233,664.00 928,429.00 0 399,800.00 1,008,743.00 6,128.00 485,719.00 12/31/2015 12/31/2016 237,292.00 68,114.00 136,859.00 53,721.00 66,612.00 27,325.00 C 12/31/2014 12/31/2015 12/31/2016 2,737,032.00 2,504,312.00 2,136 35,533 778,010 312,300.00 2,586,114.00 2,666,939.00 1,909.00 32,654.00 -8,623.00 20,500.00 2,481,890.00 2,178,356.00 3,093.00 35,390.00 -12,642.00 81,200.00 249,457.00 428,437.00 92.894.00 1 Free cash flow buildup 2 3 Fiscal year end date 4 Select Income Statement Data 5 Revenue 6 COGS, SG&A and other operating expenses 7 Interest income 8 Interest expense 9 Nonrecurring non-operating income (expense) 10 Provision for Income Taxes 11 Memo: 12 Depreciation & amortization (included in COGS, SG&A and other operating expenses) 13 14 Fiscal year end date 15 Cash and equivalents 16 Investments in marketable equity securities 17 Working capital assets 18 Intangible assets (including goodwill) 19 PP&E 20 21 Working capital liabilities 22 Current portion of long-term debt 23 Long-Term Debt 24 25 Fiscal year end date 26 Cash flows from investing activities 27 Capital expenditures and purchases of intangible assets 28 Common dividends 29 30 12/31/2015 774,952.00 379,445.00 706,325.00 1,146,589.00 231,123.00 12/31/2016 670,816.00 448,241.00 752.289.00 1,296,919.00 233,664.00 928,429.00 0 399,800.00 1,008,743.00 6,128.00 485,719.00 12/31/2015 12/31/2016 237,292.00 68,114.00 136,859.00 53,721.00 66,612.00 27,325.00Step by Step Solution
There are 3 Steps involved in it
Step: 1

Get Instant Access to Expert-Tailored Solutions
See step-by-step solutions with expert insights and AI powered tools for academic success
Step: 2

Step: 3

Ace Your Homework with AI
Get the answers you need in no time with our AI-driven, step-by-step assistance
Get Started


