Answered step by step
Verified Expert Solution
Question
1 Approved Answer
For the original series and the associated model, calculate (record) and plot 50 predictions. this is the code I have right now, but when I
For the original series and the associated model, calculate (record) and plot 50 predictions.
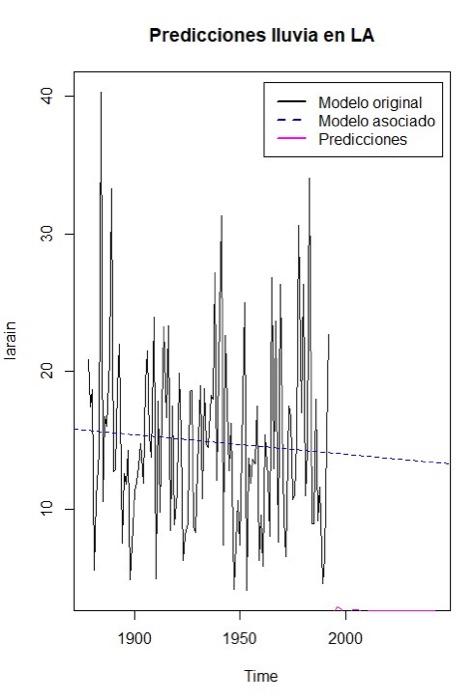
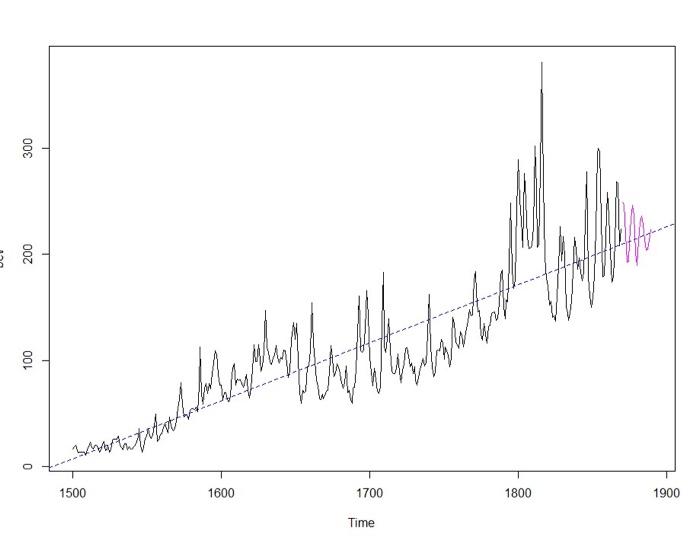
this is the code I have right now, but when I tried to graph the predictions with the original data this is the graph it shows me (I need it like the second one)
library (TSA)
data (larain)
plot (larain)
#Trend
# Linear-MEAN
linearM
abline (linearM)
summary (linearM)
# Cubic-Average
###########
## Check graphic
plot (larain)
time
terc
summary (terc) #Shows fit to cubic trend
lines (time, fitted.values (terc), col = "magenta")
#Varianza
adf.test (larain, alternative = "stationary")
#New correction
n.larain
plot (n.larain)
#Variance
adf.test (n.larain, alternative = "stationary")
#MODELING
#AR
ar (n.larain)
auxis
for (i in 1:20)
{
value
if (value
{
auxis
number
}
}
#MA
auxisM
numberM
auxisM
for (i in 1:20)
{
value
if (value
{
auxisM
numberM
}
}
auxisM
numberM
AIC (arima (larain, order = c (1,0,0), method = "ML"))
# The best that gives you is the one that throws R, in this case the 8
ana1
# It can be initialized to 0 and it would be taking into account AR, MA AND ARMA
for (j in 1:15)
{
for (i in 1:15)
{
prov
if (prov
{
ana1
Best1rma
}
}
}
ana1 #Shows the AIC of the best model
Best1rma #Show the order of the best
#Model selection ARMA (2,2)
resid. 7
mean (resid. 7)
#Variance
plot (resid.7, type = "p", ylab = "residuals", xlab = "Time", main = "Scatter plot of residuals")
#Uncorrelated
acf (resid.7, main = "Correlogram of residuals")
pacf (resid.7)
Box.test (resid.7)
# H0: residuals are independent
#Residuals as white noise
help (Box.test)
help (acf)
help (bev)
help (larain)
------------------
#predictions
pred. 22 

Predicciones lluvia en LA 40 Modelo original Modelo asociado Predicciones 30 larain 20 10 1900 1950 2000 Time 300 200 whit 100 . 1500 1600 1700 1800 1900 Time Predicciones lluvia en LA 40 Modelo original Modelo asociado Predicciones 30 larain 20 10 1900 1950 2000 Time 300 200 whit 100 . 1500 1600 1700 1800 1900 Timepred 22
plot (n.larain, xlim = c (1878,2043), main = "Rain predictions in LA", lwd = 1)
legend (x = "topright", inset = .02, legend = c ("Original model", "Associated model", "Predictions"), lty = c (1,2,1), col = c ("black" , "blue", "magenta"), lwd = 2)
lines (pred 22, col = "magenta")
ml
abline (ml, col = "blue", lty = 2, lwd = 1)
----------------------


Step by Step Solution
There are 3 Steps involved in it
Step: 1

Get Instant Access to Expert-Tailored Solutions
See step-by-step solutions with expert insights and AI powered tools for academic success
Step: 2

Step: 3

Ace Your Homework with AI
Get the answers you need in no time with our AI-driven, step-by-step assistance
Get Started


