

Answered step by step
Verified Expert Solution
Question
1 Approved Answer
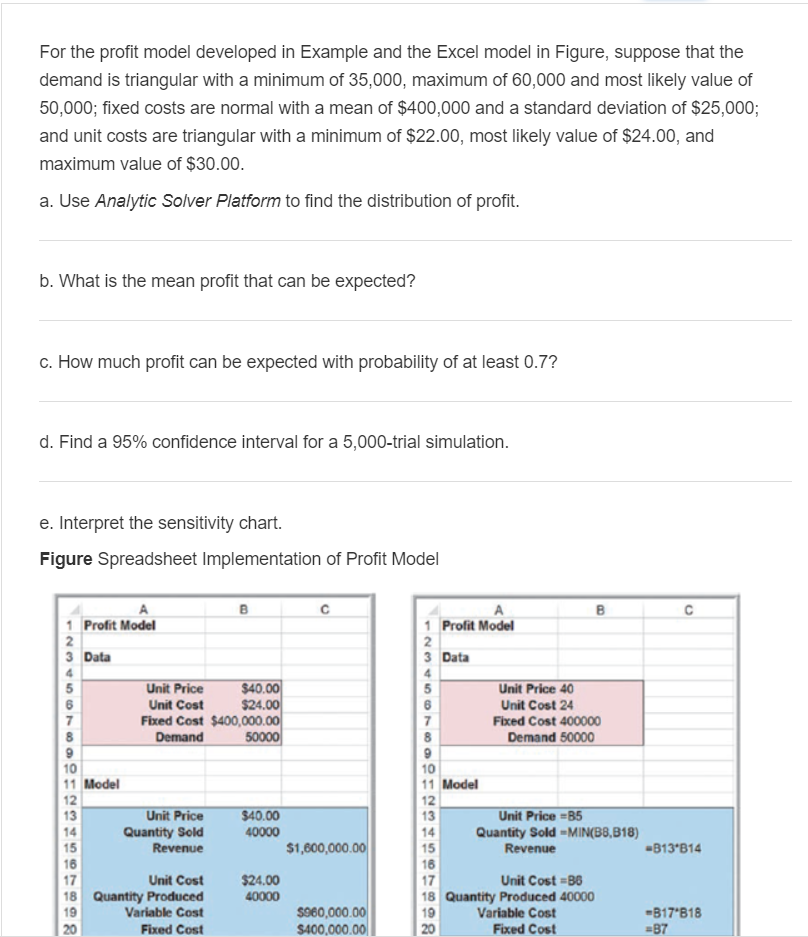
For the profit model developed in Example and the Excel model in Figure, suppose that the demand is triangular with a minimum of 35,000, maximum
Step by Step Solution
There are 3 Steps involved in it
Step: 1

Get Instant Access to Expert-Tailored Solutions
See step-by-step solutions with expert insights and AI powered tools for academic success
Step: 2

Step: 3
Ace Your Homework with AI
Get the answers you need in no time with our AI-driven, step-by-step assistance
Get Started
The People Policies Audit
Authors: Maurice A. Phelps
1st Edition
1907766049, 978-1907766046