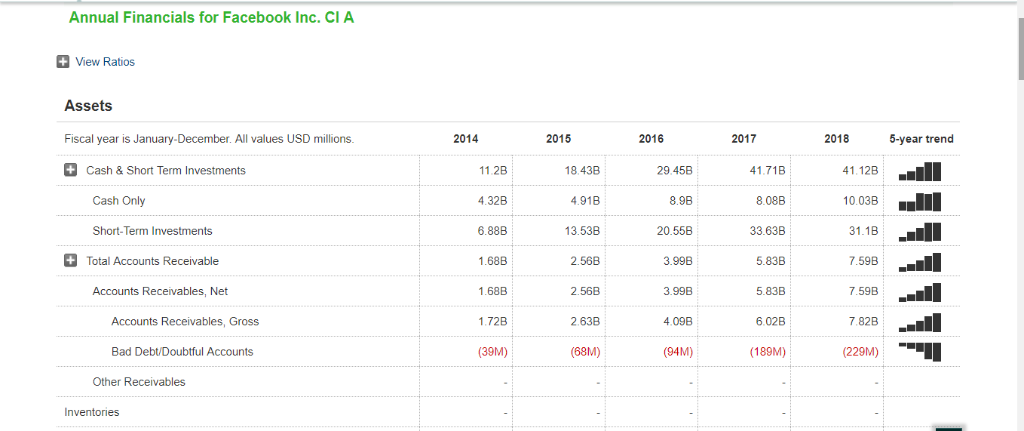
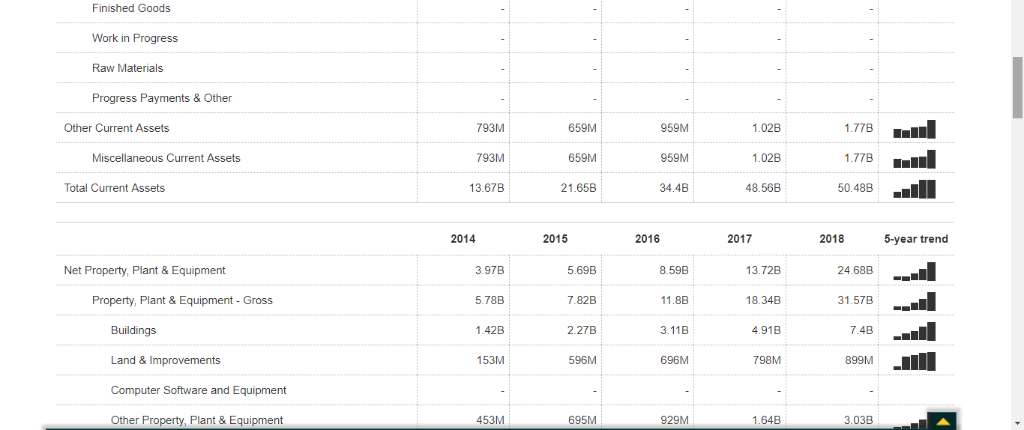
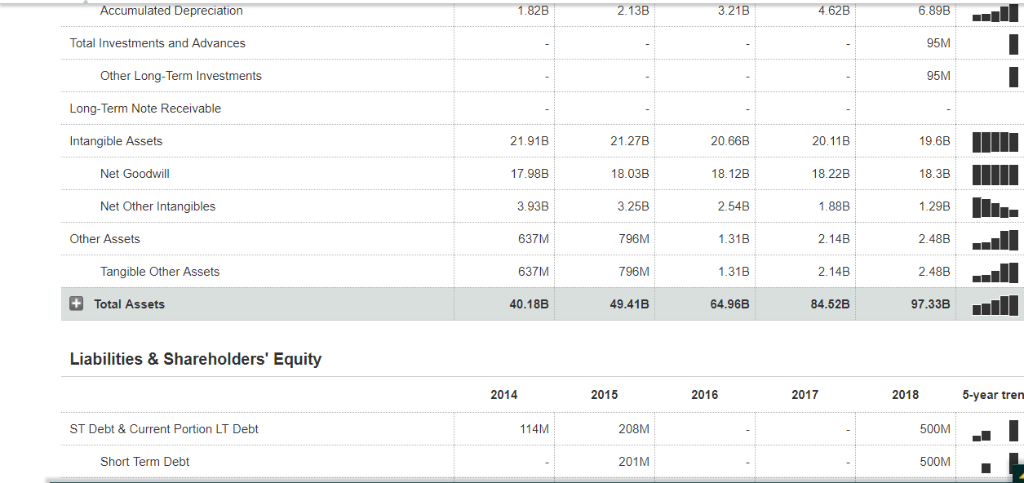
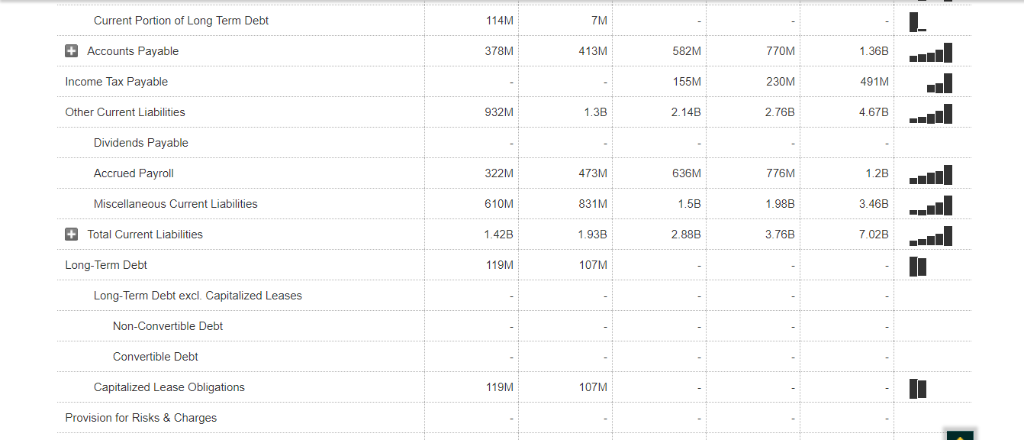
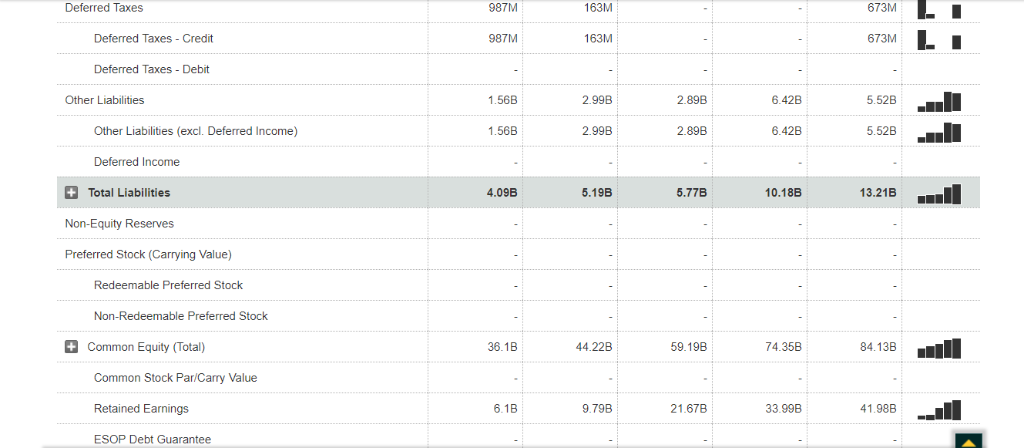

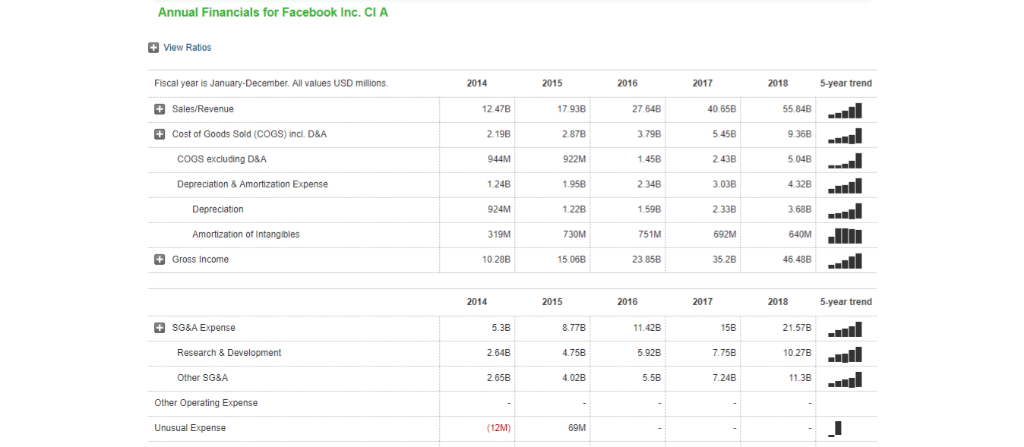
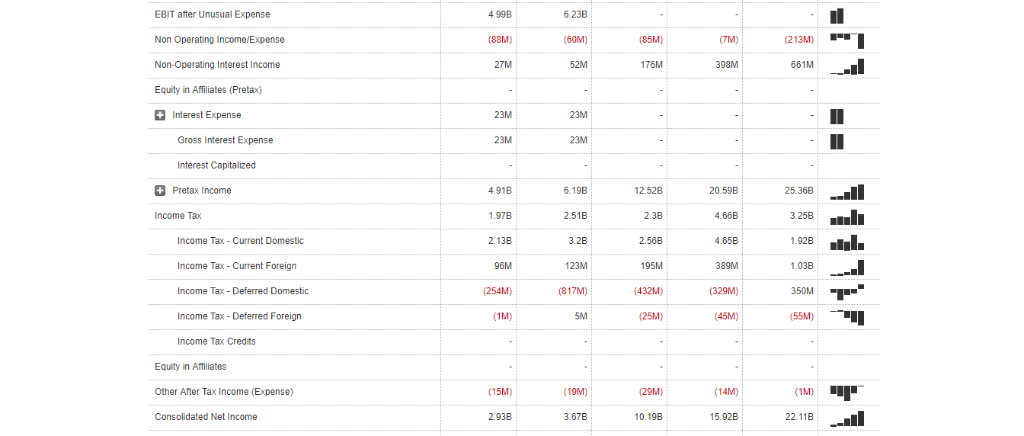
 for the public traded company Facebook-FB inc, compute the gross profit percentage and the rate of inventory turnover for 2016,2017 and 2018.Identify the classes of stock that the company has issued.Which item carries a larger balance-the Common stock account or Paid-in-capital in excess of par (Additional paid in capital)?What restrictions are put on the additional paid in.Identify the intangibles assets that were owned by the company for 2016,2017 and 2018.If these assets have no visible form,why are they assets after all.Calculate the current Ratio,the Debt Ratio and the Acid-Test Ratio for 2016,2017 and 2018.Determine whether these ratios improved or deteriorated from 2016.
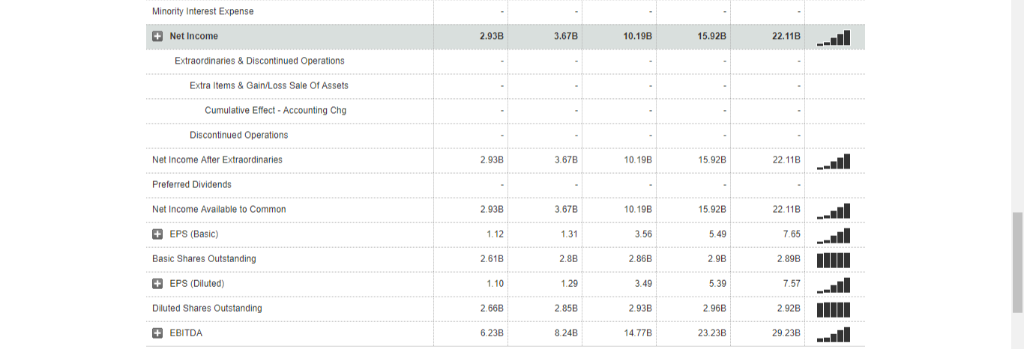
Annual Financials for Facebook Inc. CiA View Ratios Assets Fiscal year is January-December. All values USD millions. +Cash & Short Term Investments 2014 2015 2016 2017 2018 5-year trend 11.2B 4.32B 6.88B 1.68B 1.68B 1.72B (39M) 41.71B 8.08B 33.63B 5.83B 5.83B 6.02B (189M) 41.12B 0.03B 31.1B 7.59B 7.59B 7.82B (229M) 18.438 4.918 13.53B 2.56B 29.45B 8.9B 20.55B 3.99B 3.99B 4.09B (94M) Cash Only Short-Term Investments Total Accounts Receivable Accounts Receivables, Net 2.56B Accounts Receivables, Gross 2.63B -- Bad Debt/Doubtful Accounts (68M) Other Receivables Inventories Finished Goods Work in Progress Raw Materials Progress Payments & Other 659M 659M 21.658 959M 959M 34.4B 778 778 50.488 Other Current Assets 793M 793M 13.67B 1.02B 1.02B 48.56B Miscellaneous Current Assets Total Current Assets 2014 2015 2016 2017 2018 5-year trend 24.68B 1.57B 7.4B Net Property, Plant & Equipment 3.97B 5.69B 7.82B 2.27B 596M 8.59B 11.8B 3.11B 696M 13.72B Property, Plant & Equipment-Gross 5.78B 18.34B Buildings Land & Improvements Computer Software and Equipment Other Property, Plant & Equipment 1.42B 4.91B 153M 798M 899M 453M 695M 929M 1.64B ccumulated Depreciation Total Investments and Advances 95M Other Long-Term Investments 95M Long-Term Note Receivable 21.91B 17.98B 3.93B 21.27B 18.03B 3.258 796M 796M 49.41B 19.6B 18.3B 1298 2.48B 2.48B Intangible Assets 20.66B 18.12B 2.54B 1.31B 1.31B 64.96B 20.11B 18.22B 1.888 2.14B 2.14B 84.52B Net Goodwill Net Other Intangibles Other Assets 637M Tangible Other Assets 637M +Total Assets 97.338 40.18B Liabilities &Shareholders' Equity 2014 2015 2016 2017 2018 5-year tren ST Debt & Current Portion LT Debt 114M 208M 500M Short Term Debt 201M 500M Current Portion of Long Term Debt 114M 7IM +Accounts Payable 582M 155M 2.14B 770M 230M 2.76B 1.36B 491M 4.67B 378M 413M Income Tax Payable Other Current Liabilities 932M 1.3B Dividends Payable 473M 831M 1.93B 107M 636M 1.5B 2.88B 776M 1.2B 3.468 7.02B Accrued Payroll 322M 610M 1.42B 119M Miscellaneous Curent Liabilities 1.988 Total Current Liabilities 3.76B Long-Term Debt Long-Term Debt excl. Capitalized Leases Non-Convertible Debt Convertible Debt Capitalized Lease Obligations 119M 107M Provision for Risks & Charges Deferred Taxes 987M 163M 673M Deferred Taxes - Credit 987M 163M 673M Deferred Taxes - Debit Other Liabilities 1.56B 2.99B 2.89B 6.428 5.52B Other Liabilities (excl. Deferred Income) 1.56B 2.99B 2.89B 6.42B 5.52B Deferred Income +Total Liabilities Non-Equity Reserves Preferred Stock (Carrying Value) 4.09B 5.19B 5.77B 10.188 13.21B Redeemable Preferred Stock Non-Redeemable Preferred Stock +Common Equity (Total) 36.1B 44.22B 59.19B 74.358 84.13B Common Stock Par/Carry Value Retained Earnings ESOP Debt Guarantee 6.1B 9.79B 21.67B 33.99B 41.98B Cumulative Translation Adjustment/Unrealized For. Exch. Gain Unrealized Gain/Loss Marketable Securities Revaluation Reserves Treasury Stock +Total Shareholders' Equity Accumulated Minority Interest Total Equity Liabilities & Shareholders' Equity 36.18 4422859198784138l 74.358 44.22B 84.138 3618 228 5 198 74358 8138 36.1B 44.22B 59.198 84.138 40.188494186496884.52873 97.33B 64.96B Annual Financials for Facebook Inc. CI A View Ratios Fiscal year is January-December. All values USD millions 2014 2015 2016 2017 2018 5-year trend 40.658 12 47B 2.19B 44M 1.248 924M 319M 10.288 17.938 2.87B 922M 1958 122B 730M 15.068 27.64B 3.79B 1.45B 234B 1.59B 751M 23.85B 55 848 9.36B 5.048 4.328 3.688 640M 46.488 +Cost of Goods Sold (COGS) incl. D&A 5 45B COGS excluding D&A 2 43B 3.03B 2 338 692M 35.2B Depreciation& Amortization Expense Amortization of Intangibles +Gross Income 2014 2015 2016 2017 2018 5-year trend SG&A Expense 21.57B 5.38 2.64B 2.658 8.77B 4.758 4.02B 11.42B 15B Research& Development 5.92B 7.75B 10.27B Other SG&A 5.5B 7.24B 11.3B Other Operating Expense Unusual Expense (12M) 69M EBIT atter Unusual Expense Non Operating Income/Expense Non-Operating Interest Income Equity in Affiliates (Pretax) +Interest Expense 4.99B (88M) 27M 6.23B (60M) 52M (85M) 213M 176M 398M 661M 23M 23M Gross Interest Expense 23M 23M Interest Capitalized +Pretax Income 4.91B 6.19B 2.51B 3.2B 123M (817M) 5M 12.52B 2.38 2.56B 195M 432M) 20.59B 25.368 258 1.928 Income Tax 1.97B 4.66B Income Tax Current Domestic Income Tax Current Foreign Income Tax - Deferred Domestic 2.13B 4.65B 96M 389M 1.038 (254M) (329M) 350M -r- Income Tax- Deferred Foreign (1M) Income Tax Credits Equity in Amillates Other After Tax Income (Expense) Consolidated Net Income (15M) 19M) (14M) 2.93B 221 3.67B 10.198 15.92B Minority Interest Expense +Net Income 3,678 10.198 15.928 22.118 2.938 Extraordinaries & Discontinued Operations Extra Items & Gain/Loss Sale O1 Assets Cumulative Eflect Accounting Chg Discontinued Operations Net Income After Extraordinaries Preferred Dividends Net Income Available to Common +EPS (Basic) 2.938 3.67B 10.19B 2938 3.678 10.19B 15 920 2211B-11 112 1313565.497.65 2.61B 110 1293.49 3757 26682858293B29682928III 6238 8248 147782323B29238 15.92B 2.8B 2.86B 2.9B 2.898 EPS (Diluted) Diluted Shares Outstanding EBITDA


 for the public traded company Facebook-FB inc, compute the gross profit percentage and the rate of inventory turnover for 2016,2017 and 2018.Identify the classes of stock that the company has issued.Which item carries a larger balance-the Common stock account or Paid-in-capital in excess of par (Additional paid in capital)?What restrictions are put on the additional paid in.Identify the intangibles assets that were owned by the company for 2016,2017 and 2018.If these assets have no visible form,why are they assets after all.Calculate the current Ratio,the Debt Ratio and the Acid-Test Ratio for 2016,2017 and 2018.Determine whether these ratios improved or deteriorated from 2016.


