Answered step by step
Verified Expert Solution
Question
1 Approved Answer
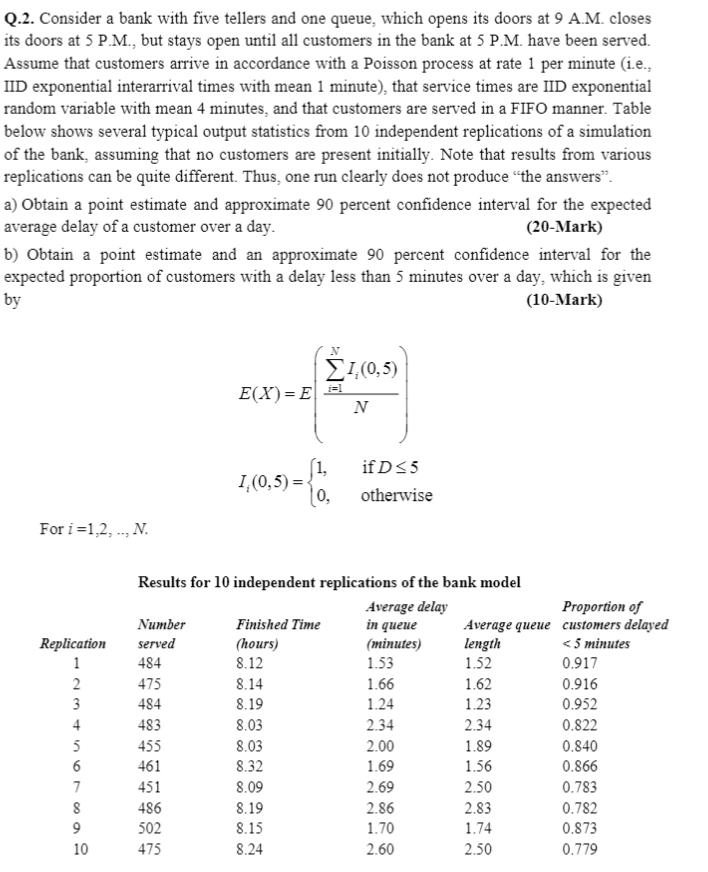
Q.2. Consider a bank with five tellers and one queue, which opens its doors at 9 A.M. closes its doors at 5 P.M., but

Q.2. Consider a bank with five tellers and one queue, which opens its doors at 9 A.M. closes its doors at 5 P.M., but stays open until all customers in the bank at 5 P.M. have been served. Assume that customers arrive in accordance with a Poisson process at rate 1 per minute (i.e., IID exponential interarrival times with mean 1 minute), that service times are IID exponential random variable with mean 4 minutes, and that customers are served in a FIFO manner. Table below shows several typical output statistics from 10 independent replications of a simulation of the bank, assuming that no customers are present initially. Note that results from various replications can be quite different. Thus, one run clearly does not produce the answers". a) Obtain a point estimate and approximate 90 percent confidence interval for the expected average delay of a customer over a day. (20-Mark) b) Obtain a point estimate and an approximate 90 percent confidence interval for the expected proportion of customers with a delay less than 5 minutes over a day, which is given by (10-Mark) For i=1,2,.., N. Replication 1 2 3 4 5 6 7 8 9 10 Number served 484 475 484 483 455 461 451 486 502 475 E(X)=E= 1,(0,5) = N 1 (0,5) N 0, Results for 10 independent replications of the bank model Average delay in queue (minutes) Finished Time (hours) 8.12 8.14 8.19 8.03 8.03 8.32 8.09 8.19 8.15 8.24 if D5 otherwise 1.53 1.66 1.24 2.34 2.00 1.69 2.69 2.86 1.70 2.60 Proportion of Average queue customers delayed length 1.52 1.62 1.23 2.34 1.89 1.56 2.50 2.83 1.74 2.50 < 5 minutes 0.917 0.916 0.952 0.822 0.840 0.866 0.783 0.782 0.873 0.779
Step by Step Solution
★★★★★
3.52 Rating (165 Votes )
There are 3 Steps involved in it
Step: 1
ANSWER a To obtain a point estimate and an approximate 90 percent confidence interval for the expected average delay of a customer over a day we can use the data provided in the table The average dela...
Get Instant Access to Expert-Tailored Solutions
See step-by-step solutions with expert insights and AI powered tools for academic success
Step: 2

Step: 3

Ace Your Homework with AI
Get the answers you need in no time with our AI-driven, step-by-step assistance
Get Started


