"For the S&P 599 index and broad market (index of all NYSE/NASDAQ/AMEX stocks) calculate the average return and standard deviation of return. Annual returns for the years 1927-2016 are presented to the left.
Arithmetic Average: S&P 500 Index is 11.69%. Broad Market Index is 11.91%
Geometric Average: S&P 500 Index is 9.79%. Broad Market Index is 9.96%.
Standard Deviation: S&P 500 Index is 19.76%. Broad Market Index is 19.99%.
How do these metrics compare between S&P 500 Index and the Broad Market Index? What do they say about the risk and return of the two indices?
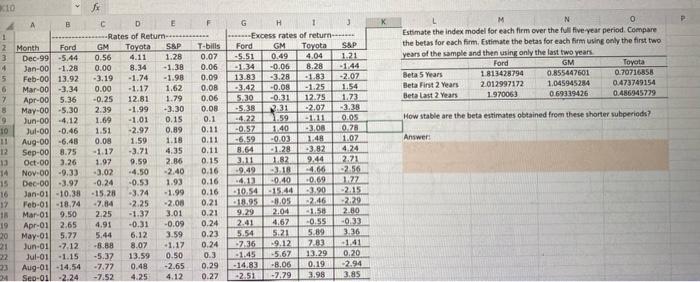
xio x 1.28 0.49 M N Estimate the index model for each firm over the fiveyear period. Compare the betas for each firm. Estimate the betas for each firm using only the first two years of the sample and then using only the last two years Ford GM Toyota Beta 5 Years 1813428794 0.855447601 0.70716858 Beta First 2 years 2012997172 1.045945284 0.473749154 Beta last 2 years 1.970063 0.69319426 0.486945779 1.69 How stable are the beta estimates obtained from these shorter superiods? Answer: B 1 2 Month Ford Dec-99 -5.44 4 Jan-00 -1.28 5 Feb-00 13.92 6 Mar-00-3.34 7 Apr-00 5.36 8 May-00 -5.30 Jun-00 -4.12 10 Jul-00 -0.46 11 Aug-00 -6.48 12 Sep-00 8.75 13 Oct-00 3.26 Nov.00 -9.33 15 Dec-00-3.97 16 Jan-01-10.38 17 Feb-01 -18,74 Mar-01 9.50 19 Apr-01 2.65 20 May-01 5.77 21 Jun-01 -7.12 Jul-01 -1.15 Aug-01 -14.54 14 Seo-011 -2.24 C D E Rates of Return- GM Toyota SAP 0.56 4.11 0.00 8.34 - 1.38 -3.19 -1.74 -1.98 0.00 -1.17 1.62 -0.25 12.81 1.79 2.39 -1.99 -3.30 -1.01 0.15 1.51 2.97 0.89 0.08 1.59 1.18 -1.17 -3.71 4.35 1.97 9.59 2.86 3.02 4.50 -2.40 -0.24 -0.53 1.93 - 15.28 -3.74 -1.99 -7.84 -2.25 -2.00 2.25 -1.37 3.01 4.91 -0.31 -0.09 5.44 6.12 3.59 -3.88 8.07 -1.17 -5.37 13.59 0.50 -7.77 0.48 -2.65 -7.52 4.25 4.12 G H 1 Excess rates of return... Ford GM Toyota S&P 5.51 4.04 1.21 -1-34 -0.06 8.28 -1.44 13.83 -3.28 -2.07 -3.42 -0.08 -1.25 1.54 5.30 -0.31 12.25 1.73 -5.38 231 -2.07 -3.38 -4.22 1.59 -1.11 0.05 -0.57 140 2.00 0.21 -0.03 1.48 1.07 8.64 1.28 3.82 3.11 1.82 9.44 2.21 -9.49 3.18 2.56 4.13 -0.40 -0.69 1.22 -10.54 -15.44 -3.90 2.15 -18.25 8.05 -2.46 229 9.29 2.04 2.80 2.41 4,67 0.55 -0.33 5.54 5.21 5.89 3.36 2:36 19.12 783 -5.67 13.29 0.20 -14.83 -8.06 0.19 -2.94 -2.51 -7.29 3.98 3.85 T-bills 0.07 0.06 0.09 0.08 0.06 0.08 0.1 0.11 0.11 0.11 0.15 0.16 0.16 0.16 0.21 0.21 0.24 0.23 0.24 0.3 0.29 0.27 424 -1.41 . xio x 1.28 0.49 M N Estimate the index model for each firm over the fiveyear period. Compare the betas for each firm. Estimate the betas for each firm using only the first two years of the sample and then using only the last two years Ford GM Toyota Beta 5 Years 1813428794 0.855447601 0.70716858 Beta First 2 years 2012997172 1.045945284 0.473749154 Beta last 2 years 1.970063 0.69319426 0.486945779 1.69 How stable are the beta estimates obtained from these shorter superiods? Answer: B 1 2 Month Ford Dec-99 -5.44 4 Jan-00 -1.28 5 Feb-00 13.92 6 Mar-00-3.34 7 Apr-00 5.36 8 May-00 -5.30 Jun-00 -4.12 10 Jul-00 -0.46 11 Aug-00 -6.48 12 Sep-00 8.75 13 Oct-00 3.26 Nov.00 -9.33 15 Dec-00-3.97 16 Jan-01-10.38 17 Feb-01 -18,74 Mar-01 9.50 19 Apr-01 2.65 20 May-01 5.77 21 Jun-01 -7.12 Jul-01 -1.15 Aug-01 -14.54 14 Seo-011 -2.24 C D E Rates of Return- GM Toyota SAP 0.56 4.11 0.00 8.34 - 1.38 -3.19 -1.74 -1.98 0.00 -1.17 1.62 -0.25 12.81 1.79 2.39 -1.99 -3.30 -1.01 0.15 1.51 2.97 0.89 0.08 1.59 1.18 -1.17 -3.71 4.35 1.97 9.59 2.86 3.02 4.50 -2.40 -0.24 -0.53 1.93 - 15.28 -3.74 -1.99 -7.84 -2.25 -2.00 2.25 -1.37 3.01 4.91 -0.31 -0.09 5.44 6.12 3.59 -3.88 8.07 -1.17 -5.37 13.59 0.50 -7.77 0.48 -2.65 -7.52 4.25 4.12 G H 1 Excess rates of return... Ford GM Toyota S&P 5.51 4.04 1.21 -1-34 -0.06 8.28 -1.44 13.83 -3.28 -2.07 -3.42 -0.08 -1.25 1.54 5.30 -0.31 12.25 1.73 -5.38 231 -2.07 -3.38 -4.22 1.59 -1.11 0.05 -0.57 140 2.00 0.21 -0.03 1.48 1.07 8.64 1.28 3.82 3.11 1.82 9.44 2.21 -9.49 3.18 2.56 4.13 -0.40 -0.69 1.22 -10.54 -15.44 -3.90 2.15 -18.25 8.05 -2.46 229 9.29 2.04 2.80 2.41 4,67 0.55 -0.33 5.54 5.21 5.89 3.36 2:36 19.12 783 -5.67 13.29 0.20 -14.83 -8.06 0.19 -2.94 -2.51 -7.29 3.98 3.85 T-bills 0.07 0.06 0.09 0.08 0.06 0.08 0.1 0.11 0.11 0.11 0.15 0.16 0.16 0.16 0.21 0.21 0.24 0.23 0.24 0.3 0.29 0.27 424 -1.41


