

Question
For the third assignment, you will get a chance to do some more programming in Java by implementing a histogram viewer. The input (specified below)
For the third assignment, you will get a chance to do some more programming in Java by implementing a histogram viewer. The input (specified below) will be fed into your program via standard input (stdin). Your program should then display a histogram of the data, rendered in the console. You can think of this kind of like a very basic form of ASCII art. You are encouraged to be creative in both your design of the program and the display of the histogram. Along with the histogram, you should also display the minimum, maximum, and mean. Feel free to display other relevant information or statistics along with the histogram.
Program - Minimum Requirements
- Read from stdin the specified input
- Display a histogram of the data
- Display minimum, maximum, and mean
- Exit (program terminates once it has finished rendering i.e. does not wait for a key to be pressed)
Project - Requirements
- All code should be in the a3 package.
- The main method for your program should be in the class ConsoleHistogram.
Input Specification
Input will be fed to your program through standard in. Each item that is provided will be separated by a space. The input will always be provided in the following order.
- The number of bins the histogram should have.
- Each data point (space separated again).
- The word "end"
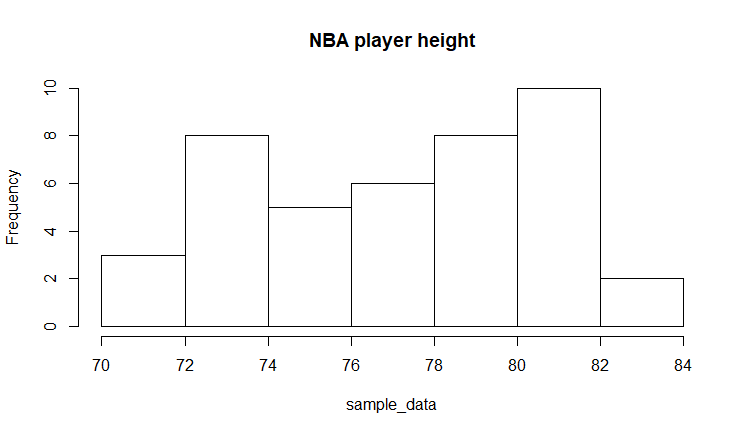
You have been provided with a text file with the smaller data set below and also a large one that includes most NBA players. An example input is inside a file named nba_heights_sample.txt along with histograms of what the data looks like when plotted with a graphical plotting package.
7 81 82 75 73 74 74 79 72 84 80 77 73 77 81 80 82 75 77 81 80 82 71 79 79 80 77 77 73 72 75 74 83 78 76 79 73 81 81 82 73 82 76
Output
Your program should create a histogram by printing ASCII characters to the console one line at a time. You can be creative about how to create this depiction. It can be horizontally aligned (easier) or vertically aligned (a little more challenging). Here is what my solution produces. It includes bin labels and the raw count in each bin. Your solution does NOT need to look like mine or be as sophisticated as long as there is a visual element for each bin that has the appropriate relative size to the other bins.
Num bins: 16 Min: 63 Max: 91 Avg: 78.42798594847775 722 +-+ |*| |*| 611 |*| +-+ |*| 524 |*| |*| +-+ |*| |*| |*| |*| |*| 459 |*| |*| |*| +-+ 361 |*| |*| |*| |*| +-+ |*| |*| |*| 352 |*| |*| |*| |*| |*| +-+ |*| |*| |*| |*| |*| |*| |*| |*| |*| |*| |*| |*| |*| |*| |*| |*| |*| |*| |*| 188 |*| |*| |*| |*| |*| |*| +-+ |*| |*| |*| |*| |*| |*| |*| 88 |*| |*| |*| |*| |*| |*| |*| 53 +-+ |*| |*| |*| |*| |*| |*| |*| 1 1 4 7 +-+ |*| |*| |*| |*| |*| |*| |*| |*| 34 7 4 ------------------------------------------------------------------ 63 64 66 68 70 72 73 75 77 79 81 82 84 86 88 90
Hints and Tips
- Use a List
object to hold the data values read as input. You'll need to find the minimum and maximum values to determine the range the bins need to span and the bin boundaries. - To read the input, use a Scanner object like in A1 and A2. After reading the first integer indicating the number of bins, use a while loop with the hasNextInt() method to read the remaining input into your list until hasnextInt() returns false. This will happen when you get to the word "end" at the end.
- You are free to decide for yourself anything not specified otherwise in this writeup.
NBA player height 10 8 6 Frequency 4 2 0 GE 70 72 74 76 78 80 82 84 sample_data
Step by Step Solution
There are 3 Steps involved in it
Step: 1

Get Instant Access to Expert-Tailored Solutions
See step-by-step solutions with expert insights and AI powered tools for academic success
Step: 2

Step: 3
Ace Your Homework with AI
Get the answers you need in no time with our AI-driven, step-by-step assistance
Get Started
Advances In Databases And Information Systems Second East European Symposium Adbis 98 Poznan Poland September 1998 Proceedings Lncs 1475
Authors: Witold Litwin ,Tadeusz Morzy ,Gottfried Vossen
1st Edition
3540649247, 978-3540649243