

Answered step by step
Verified Expert Solution
Question
1 Approved Answer
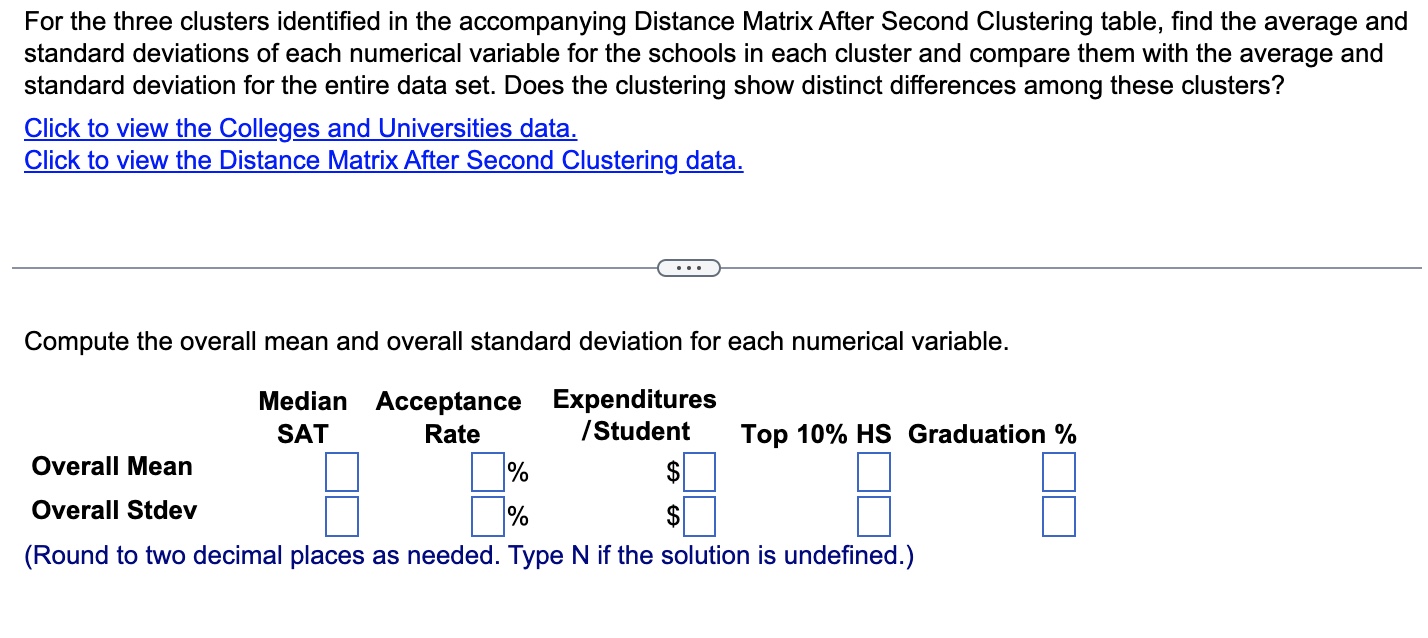
For the three clusters identified in the accompanying Distance Matrix After Second Clustering table, find the average and standard deviations of each numerical variable for
Step by Step Solution
There are 3 Steps involved in it
Step: 1

Get Instant Access to Expert-Tailored Solutions
See step-by-step solutions with expert insights and AI powered tools for academic success
Step: 2

Step: 3
Ace Your Homework with AI
Get the answers you need in no time with our AI-driven, step-by-step assistance
Get Started
Essentials of Management
Authors: Andrew J. DuBrin
9th Edition
538478233, 2900538478235, 978-0538478236