

Answered step by step
Verified Expert Solution
Question
1 Approved Answer
for the turnover ratios, profitablity ratios and leverage ratios hows his performing rlelative to benchmark? Younded the following income Statement and Bone Sheet for Mellone
for the turnover ratios, profitablity ratios and leverage ratios hows his performing rlelative to benchmark? 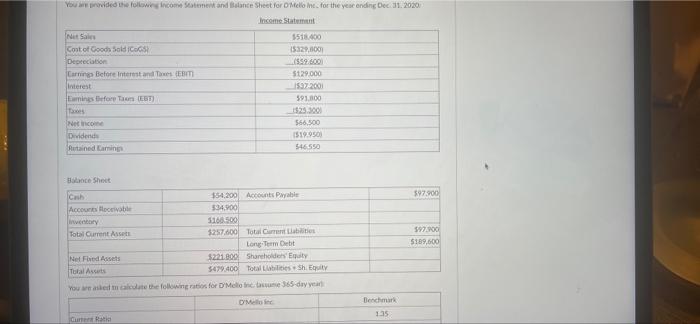
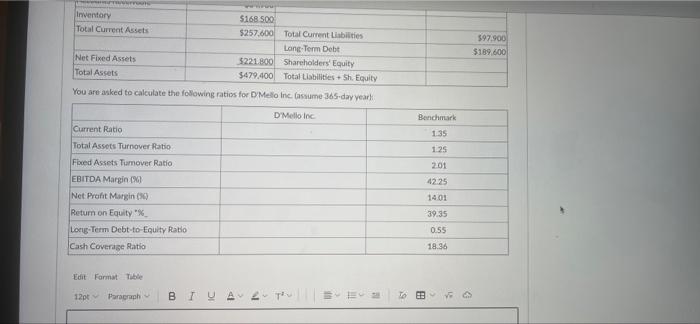
Younded the following income Statement and Bone Sheet for Mellone for the year ending Dec.31.2020 Income Statut Net Sales Contot Goodh Soldo Depreciation Carn Before Interest and The EBITI Interest Emines Before Than ET tes Netice Dividende Putained Gaming 5538.000 1532,000 1959.800 5129.000 1592-2003 591.800 566,500 1519.9503 546 550 $97.900 ce Sheet (can $54,200 Accounts Payable Account Hoove 534.900 wy 160.500 Total Current Asset $257.600 Total ment be Long-Term Debt Net Fred Assets $221.000 Shareholders' Equity Total Assets 5479.400 Total abilities Sh. Erity you wanted at the following rates for D'Melone 365 day year 592.00 $189,600 O'M Benchmark 135 GER Inventory $168.500 Total Current Assets $257.600 Total Current Liabilities Long Term Debt Net Fixed Assets $221.800 Shareholders' Equity Total Assets $479,400 Total Liabilities + Sh Equity You are asked to calculate the following ratios for Mello Inc. Gassume 365-day year 397.900 $189.600 D'Mello in Benchmark Current Ratio 135 1.25 201 42.25 Total Assets Turnover Ratio Foxed Assets Turnover Ratio EBITDA Margin Net Profit margin Return on Equity Long-Term Debt-to Equity Ratio Cash Coverage Ratio 1401 39.35 0.55 18.36 Edit Format Tube 12pt Paragraph BTUA TO ES V Step by Step Solution
There are 3 Steps involved in it
Step: 1

Get Instant Access to Expert-Tailored Solutions
See step-by-step solutions with expert insights and AI powered tools for academic success
Step: 2

Step: 3
Ace Your Homework with AI
Get the answers you need in no time with our AI-driven, step-by-step assistance
Get Started
Port Infrastructure Finance
Authors: Hilde Meersman, Eddy Van De Voorde, Thierry Vanelslander
1st Edition
0415720060, 978-0415720069