For the two companies, answer the following based on the provided cash flows.
Walt Disney:

Netflix:

-
Which method is used to calculate the cash provided or used by operations? How do you know?
-
What are the three top items that increased cash provided by operations?
-
What three items decreased cash provided by operations?
-
Overall, was cash increased or decreased by operating activities?
-
Did investing activities in total increase cash or decrease cash during the year? What were the major uses or sources of cash related to investing?
-
Did financing activities in total increase cash or decrease cash during the year? What were the major uses or sources of cash related to financing?
-
What items (if any) are disclosed as significant non-cash financing or investing activities?
-
Which of the two companies is stronger than the other based on their statement of cash flows? What clues do you have?
-
Considering the 2020 pandemic, what sort of trends do you anticipate for your chosen companies on their next annual statement of cash flows as regards cash provided by/used in operations, investing, and financing. Provide support for your rationale.
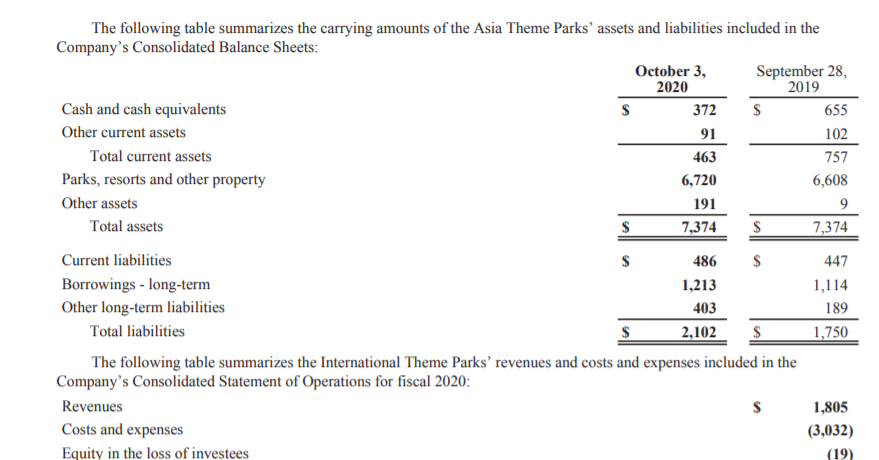
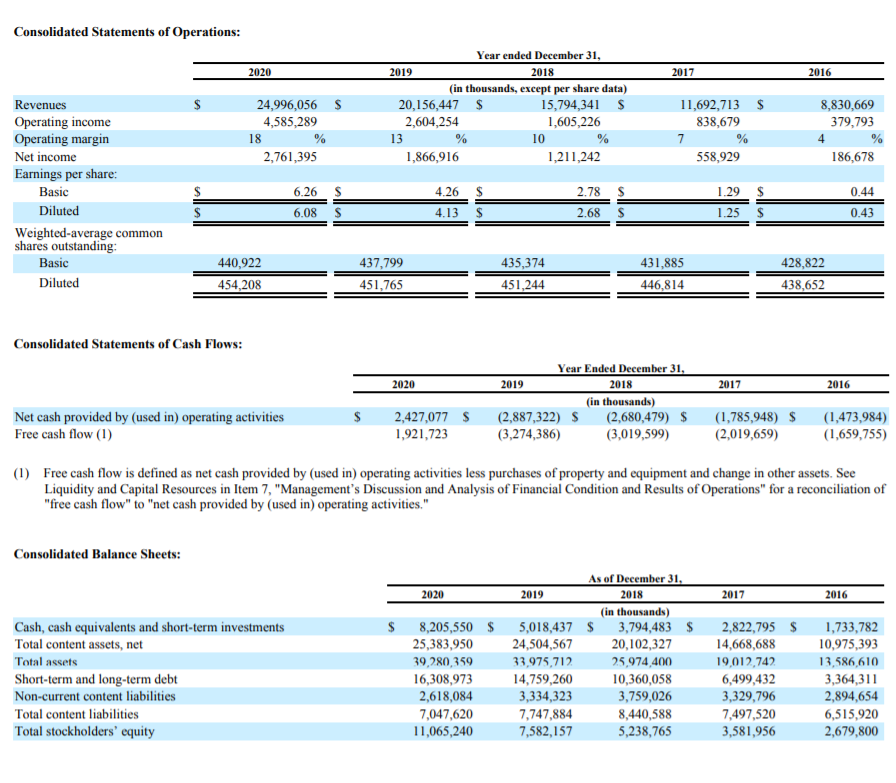
The following table summarizes the carrying amounts of the Asia Theme Parks' assets and liabilities included in the Company's Consolidated Balance Sheets: October 3, September 28, 2020 2019 Cash and cash equivalents $ 372 $ 655 Other current assets 91 102 Total current assets 463 757 Parks, resorts and other property 6,720 6,608 Other assets 191 9 Total assets $ 7,374 $ 7,374 Current liabilities $ 486 $ 447 Borrowings - long-term 1,213 1,114 Other long-term liabilities 403 189 Total liabilities 2,102 $ 1,750 The following table summarizes the International Theme Parks' revenues and costs and expenses included in the Company's Consolidated Statement of Operations for fiscal 2020: Revenues $ 1,805 Costs and expenses (3,032) Equity in the loss of investees (19) Consolidated Statements of Operations: 2020 2017 2016 24,996,056 $ 4,585,289 18 2,761,395 Year ended December 31, 2019 2018 (in thousands, except per share data) 20,156,447 $ 15,794,341 $ 2,604,254 1,605,226 13 % 10 1,866,916 1,211,242 11,692,713 $ 838,679 7 % 558,929 8,830,669 379,793 4 186,678 Revenues Operating income Operating margin Net income Earnings per share: Basic Diluted Weighted average common shares outstanding: Basic Diluted 6.26 $ 6.08 S 4.26 $ 4.13 $ 2.78 $ 2.68 S 1.29 $ 1.25 0.44 0.43 435,374 440,922 454,208 437,799 451,765 431,885 446,814 428,822 438,652 451,244 Consolidated Statements of Cash Flows: 2020 2017 2016 Year Ended December 31, 2019 2018 (in thousands) (2,887,322) $ (2,680,479) $ (3,274,386) (3,019,599) $ Net cash provided by (used in) operating activities Free cash flow (1) 2,427,077 $ 1,921,723 (1,785,948) $ (2,019,659) (1,473,984) (1,659,755) (1) Free cash flow is defined as net cash provided by (used in) operating activities less purchases of property and equipment and change in other assets. See Liquidity and Capital Resources in Item 7, "Management's Discussion and Analysis of Financial Condition and Results of Operations" for a reconciliation of "free cash flow" to "net cash provided by (used in) operating activities." I Consolidated Balance Sheets: 2017 2016 $ Cash, cash equivalents and short-term investments Total content assets, net Total assets Short-term and long-term debt Non-current content liabilities Total content liabilities Total stockholders' equity As of December 31, 2020 2019 2018 (in thousands) 8,205,550 $ 5,018,437 $ 3,794,483 $ 25,383,950 24,504,567 20,102,327 39,280,359 33,975,712 25,974,400 16,308,973 14,759,260 10,360,058 2,618,084 3,334,323 3,759,026 7,047,620 7,747,884 8,440,588 11,065,240 7,582,157 5,238,765 2,822,795 $ 14,668,688 19,012,742 6,499,432 3,329,796 7,497,520 3,581,956 1,733,782 10,975,393 13,586,610 3,364,311 2,894,654 6,515,920 2,679,800 The following table summarizes the carrying amounts of the Asia Theme Parks' assets and liabilities included in the Company's Consolidated Balance Sheets: October 3, September 28, 2020 2019 Cash and cash equivalents $ 372 $ 655 Other current assets 91 102 Total current assets 463 757 Parks, resorts and other property 6,720 6,608 Other assets 191 9 Total assets $ 7,374 $ 7,374 Current liabilities $ 486 $ 447 Borrowings - long-term 1,213 1,114 Other long-term liabilities 403 189 Total liabilities 2,102 $ 1,750 The following table summarizes the International Theme Parks' revenues and costs and expenses included in the Company's Consolidated Statement of Operations for fiscal 2020: Revenues $ 1,805 Costs and expenses (3,032) Equity in the loss of investees (19) Consolidated Statements of Operations: 2020 2017 2016 24,996,056 $ 4,585,289 18 2,761,395 Year ended December 31, 2019 2018 (in thousands, except per share data) 20,156,447 $ 15,794,341 $ 2,604,254 1,605,226 13 % 10 1,866,916 1,211,242 11,692,713 $ 838,679 7 % 558,929 8,830,669 379,793 4 186,678 Revenues Operating income Operating margin Net income Earnings per share: Basic Diluted Weighted average common shares outstanding: Basic Diluted 6.26 $ 6.08 S 4.26 $ 4.13 $ 2.78 $ 2.68 S 1.29 $ 1.25 0.44 0.43 435,374 440,922 454,208 437,799 451,765 431,885 446,814 428,822 438,652 451,244 Consolidated Statements of Cash Flows: 2020 2017 2016 Year Ended December 31, 2019 2018 (in thousands) (2,887,322) $ (2,680,479) $ (3,274,386) (3,019,599) $ Net cash provided by (used in) operating activities Free cash flow (1) 2,427,077 $ 1,921,723 (1,785,948) $ (2,019,659) (1,473,984) (1,659,755) (1) Free cash flow is defined as net cash provided by (used in) operating activities less purchases of property and equipment and change in other assets. See Liquidity and Capital Resources in Item 7, "Management's Discussion and Analysis of Financial Condition and Results of Operations" for a reconciliation of "free cash flow" to "net cash provided by (used in) operating activities." I Consolidated Balance Sheets: 2017 2016 $ Cash, cash equivalents and short-term investments Total content assets, net Total assets Short-term and long-term debt Non-current content liabilities Total content liabilities Total stockholders' equity As of December 31, 2020 2019 2018 (in thousands) 8,205,550 $ 5,018,437 $ 3,794,483 $ 25,383,950 24,504,567 20,102,327 39,280,359 33,975,712 25,974,400 16,308,973 14,759,260 10,360,058 2,618,084 3,334,323 3,759,026 7,047,620 7,747,884 8,440,588 11,065,240 7,582,157 5,238,765 2,822,795 $ 14,668,688 19,012,742 6,499,432 3,329,796 7,497,520 3,581,956 1,733,782 10,975,393 13,586,610 3,364,311 2,894,654 6,515,920 2,679,800


