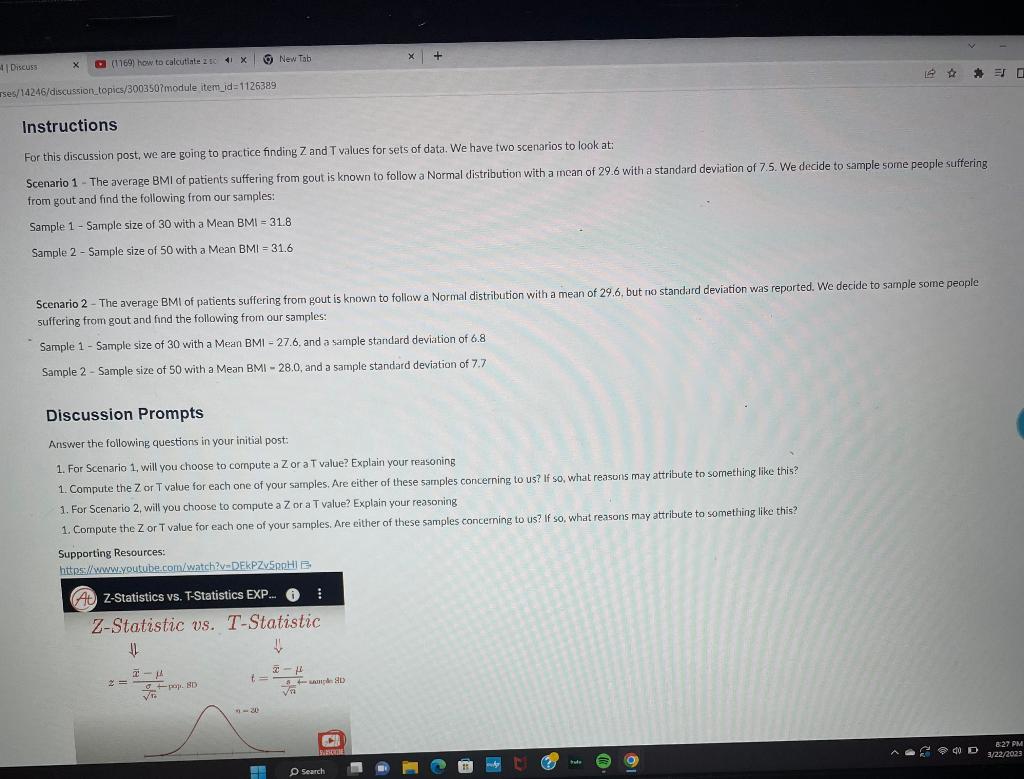
For this discussion post, we are going to practice finding Z and T values for sets of data. We have two scenarios to look at: Scenario 1 - The average BMI of patients suffering from gout is known to follow a Normal distribution with a mean of 29.6 with a standard deviation of 7.5 . We decide to sample some people suffering from gout and find the following from our samples: Sample 1 - Sample size of 30 with a Mean BM1=31.8 Sample 2 - Sample size of 50 with a Mean BMI=31.6 Scenario 2 - The average BMl of patients suffering from gout is known to follow a Normal distribution with a mean of 29,6 , but no standard deviation was reported. We decide to sample some people suffering from gout and find the following from our samples: Sample 1 - Sample size of 30 with a Mean BMI - 27.6, and a sample standard deviation of 6.8 Sample 2 - Sample size of 50 with a Mean BMI - 28.0, and a sample standard deviation of 7.7 Discussion Prompts Answer the following questions in your initial post: 1. For Scenario 1, will you choose to compute a Z or a T value? Explain your reasoning 1. Compute the Z or T value for each one of your samples. Are either of these samples concerning to us? If so, what reasons may attribute to something like this? 1. For Scenario 2, will you choose to compute a Z or a T value? Explain your reasoning 1. Compute the Z or T value for each one of your samples. Are either of these samples concerning to us? If so, what reasons may attribute to something like this? Supporting Resources: hitpesi/lwwwiyoutube com/watchiv=DEkPZv5RpHI (At) Z-Statistics vs. T-Statistics EXP... (i : Z-Statistic vs. T-Statistic For this discussion post, we are going to practice finding Z and T values for sets of data. We have two scenarios to look at: Scenario 1 - The average BMI of patients suffering from gout is known to follow a Normal distribution with a mean of 29.6 with a standard deviation of 7.5 . We decide to sample some people suffering from gout and find the following from our samples: Sample 1 - Sample size of 30 with a Mean BM1=31.8 Sample 2 - Sample size of 50 with a Mean BMI=31.6 Scenario 2 - The average BMl of patients suffering from gout is known to follow a Normal distribution with a mean of 29,6 , but no standard deviation was reported. We decide to sample some people suffering from gout and find the following from our samples: Sample 1 - Sample size of 30 with a Mean BMI - 27.6, and a sample standard deviation of 6.8 Sample 2 - Sample size of 50 with a Mean BMI - 28.0, and a sample standard deviation of 7.7 Discussion Prompts Answer the following questions in your initial post: 1. For Scenario 1, will you choose to compute a Z or a T value? Explain your reasoning 1. Compute the Z or T value for each one of your samples. Are either of these samples concerning to us? If so, what reasons may attribute to something like this? 1. For Scenario 2, will you choose to compute a Z or a T value? Explain your reasoning 1. Compute the Z or T value for each one of your samples. Are either of these samples concerning to us? If so, what reasons may attribute to something like this? Supporting Resources: hitpesi/lwwwiyoutube com/watchiv=DEkPZv5RpHI (At) Z-Statistics vs. T-Statistics EXP... (i : Z-Statistic vs. T-Statistic