

Answered step by step
Verified Expert Solution
Question
1 Approved Answer
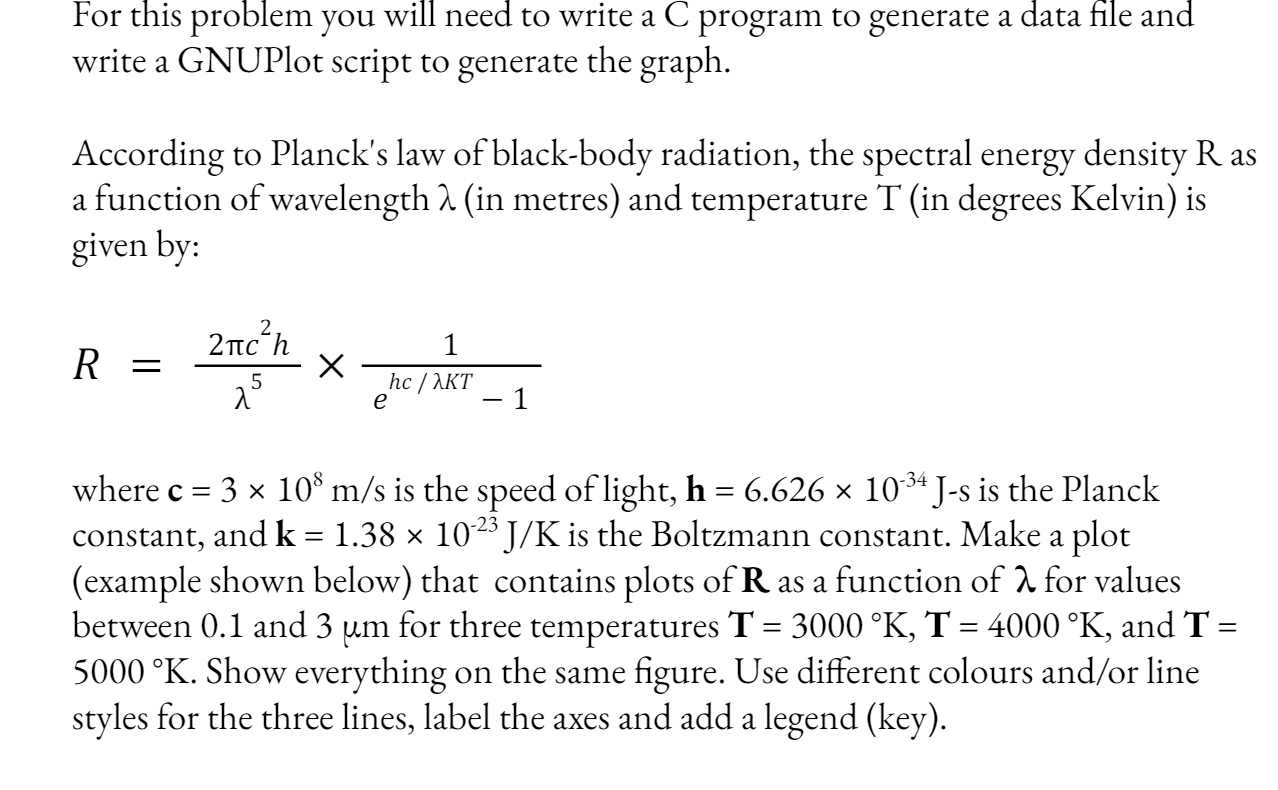
For this problem you will need to write a C program to generate a data file and write a GNUPlot script to generate the graph.
For this problem you will need to write a program to generate a data file and
write a GNUPlot script to generate the graph.
According to Planck's law of blackbody radiation, the spectral energy density as
a function of wavelength in metres and temperature in degrees Kelvin is
given by:
where is the speed of light, s is the Planck
constant, and is the Boltzmann constant. Make a plot
example shown below that contains plots of as a function of for values
between and for three temperatures and
Show everything on the same figure. Use different colours andor line
styles for the three lines, label the axes and add a legend key
Step by Step Solution
There are 3 Steps involved in it
Step: 1

Get Instant Access to Expert-Tailored Solutions
See step-by-step solutions with expert insights and AI powered tools for academic success
Step: 2

Step: 3
Ace Your Homework with AI
Get the answers you need in no time with our AI-driven, step-by-step assistance
Get Started
The Accidental Data Scientist
Authors: Amy Affelt
1st Edition
1573877077, 9781573877077