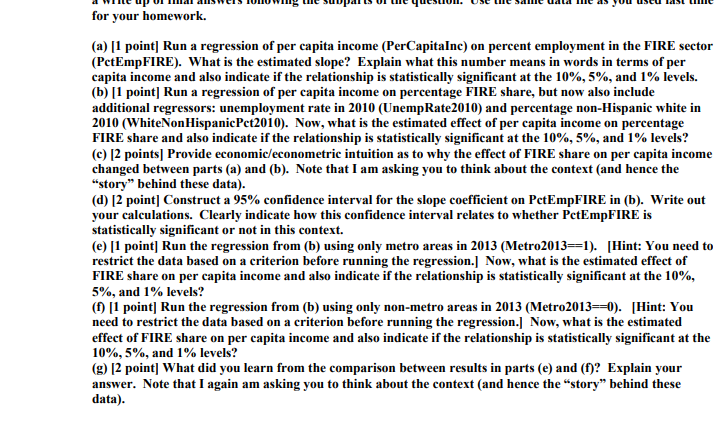
for your homework. (a) [1 point] Run a regression of per capita income (PerCapitaInc) on percent employment in the FIRE sector (PetEmpFIRE). What is the estimated slope? Explain what this number means in words in terms of per capita income and also indicate if the relationship is statistically significant at the 10%, 5%, and 1% levels. (b) [1 point] Run a regression of per capita income on percentage FIRE share, but now also include additional regressors: unemployment rate in 2010 (UnempRate2010) and percentage non-Hispanic white in 2010 (WhiteNon HispanicPet2010). Now, what is the estimated effect of per capita income on percentage FIRE share and also indicate if the relationship is statistically significant at the 10%, 5%, and 1% levels? (c) [2 points] Provide economic/econometric intuition as to why the effect of FIRE share on per capita income changed between parts (a) and (b). Note that I am asking you to think about the context (and hence the "story" behind these data). (d) [2 point] Construct a 95% confidence interval for the slope coefficient on PetEmpFIRE in (b). Write out your calculations. Clearly indicate how this confidence interval relates to whether PetEmpFIRE is statistically significant or not in this context. (e) [1 point] Run the regression from (b) using only metro areas in 2013 (Metro2013=1). [Hint: You need to restrict the data based on a criterion before running the regression.] Now, what is the estimated effect of FIRE share on per capita income and also indicate if the relationship is statistically significant at the 10% 5%, and 1% levels? (f) [1 point] Run the regression from (b) using only non-metro areas in 2013 (Metro2013==0). [Hint: You need to restrict the data based on a criterion before running the regression.] Now, what is the estimated effect of FIRE share on per capita income and also indicate if the relationship is statistically significant at the 10%, 5%, and 1% levels? (g) [2 point] What did you learn from the comparison between results in parts (e) and (f)? Explain your answer. Note that I again am asking you to think about the context (and hence the "story" behind these data)