Forecast 1 year for the income statement. Put a reason next to each line as to how you are forecasting it. (i.e. common sized of of sales, CAGR, flat, etc) Please note that certain expenses should not be forecast off of Total Revenue...why? 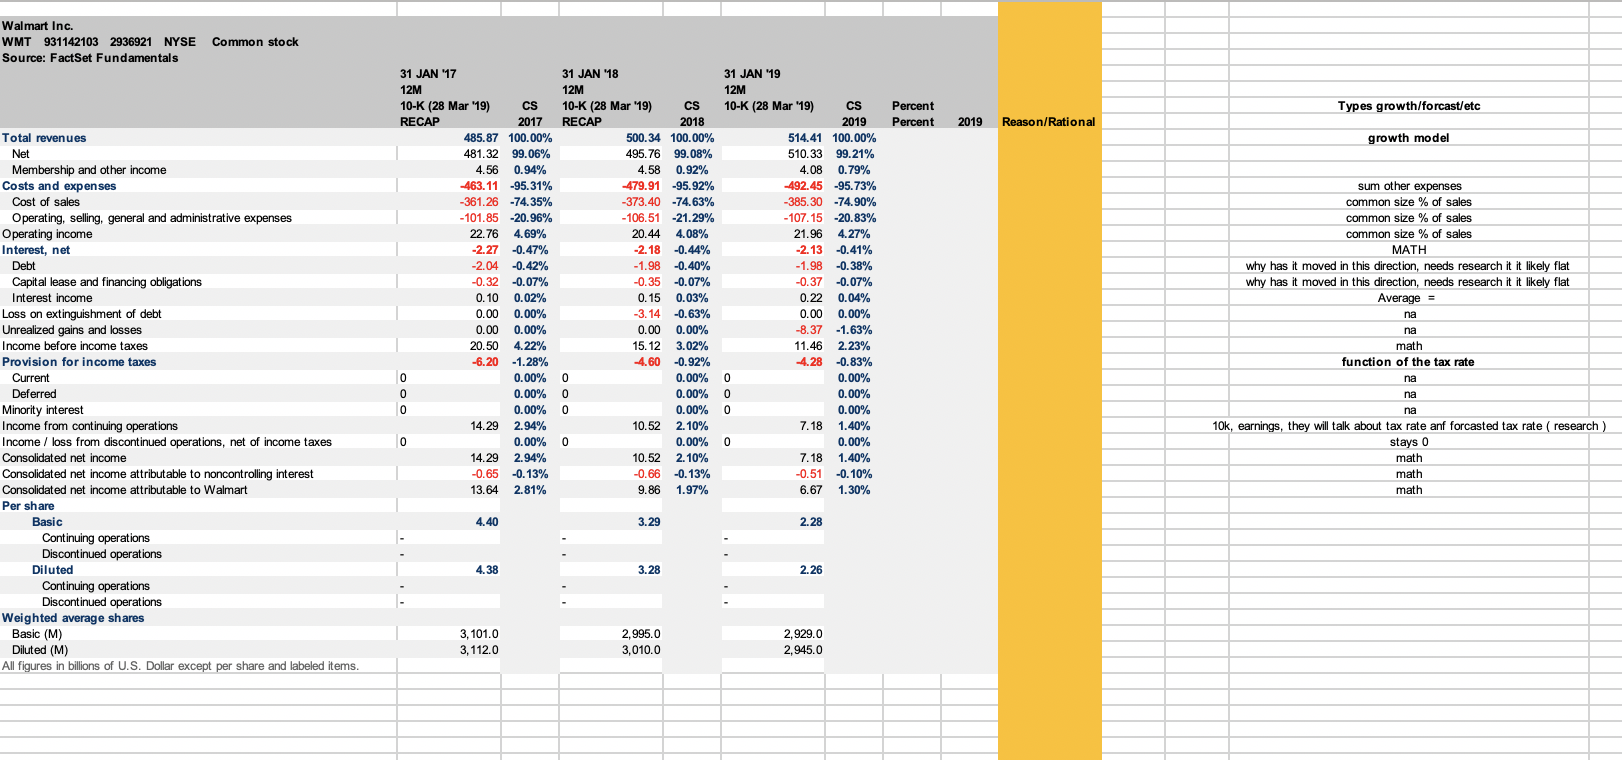
Walmart Inc. WMT 931142103 2936921 NYSE Common stock Source: FactSet Fundamentals Types growth/forcast/etc Percent Percent 2019 Reason/Rational growth model Total revenues Net Membership and other income Costs and expenses Cost of sales Operating, selling, general and administrative expenses Operating income Interest, net Debt Capital lease and financing obligations Interest income Loss on extinguishment of debt Unrealized gains and losses Income before income taxes Provision for income taxes Current Deferred Minority interest Income from continuing operations Income / loss from discontinued operations, net of income taxes Consolidated net income Consolidated net income attributable to noncontrolling interest Consolidated net income attributable to Walmart Per share Basic Continuing operations Discontinued operations Diluted Continuing operations Discontinued operations Weighted average shares Basic (M) Diluted (M) All figures in billions of U.S. Dollar except per share and labeled items. 31 JAN '17 12M 10-K (28 Mar '19) CS RECAP 2017 485.87 100.00% 481.32 99.06% 4.56 0.94% -463.11 -95.31% -361.26 -74.35% - 101.85 -20.96% 22.76 4.69% -2.27 -0.47% -2.04 -0.42% -0.32 -0.07% 0.10 0.02% 0.00 0.00% 0.00 0.00% 20.50 4.22% -6.20 -1.28% 0.00% 0.00% 0.00% 14.29 2.94% 0.00% 14.29 2.94% -0.65 -0.13% 13.64 2.81% 31 JAN '18 12M 10-K (28 Mar '19) CS RECAP 2018 500.34 100.00% 495.76 99.08% 4.58 0.92% -479.91 -95.92% -373.40 -74.63% - 106.51 -21.29% 20.44 4.08% -2.18 -0.44% -1.98 -0.40% -0.35 -0.07% 0.15 0.03% -3.14 -0.63% 0.00 0.00% 15.12 3.02% 4.60 -0.92% 0 0.00% 0 0.00% 0 0.00% 10.52 2.10% 0.00% 10.52 2. 10% -0.66 -0.13% 9.86 1.97% 31 JAN 19 12M 10-K (28 Mar '19) CS 2019 514.41 100.00% 510.33 99.21% 4.08 0.79% -492.45 -95.73% -385.30 -74.90% - 107.15 -20.83% 21.96 4.27% -2.13 -0.41% -1.98 -0.38% -0.37 -0.07% 0.22 0.04% 0.00 0.00% -8.37 -1.63% 11.46 2.23% 4.28 -0.83% 0 0.00% 0 0.00% 0 0.00% 7.18 1.40% 0 0.00% 7.18 1.40% -0.51 -0.10% 6.67 1.30% sum other expenses common size % of sales common size % of sales common size % of sales MATH why has it moved in this direction, needs research it it likely flat why has it moved in this direction, needs research it it likely flat Average = na na math function of the tax rate na na na 10k, earnings, they will talk about tax rate anf forcasted tax rate research) stays o math math math 4.40 3.29 2.28 4.38 3.28 2.26 3,101.0 3,112.0 2,995.0 3,010.0 2,929.0 2,945.0 Walmart Inc. WMT 931142103 2936921 NYSE Common stock Source: FactSet Fundamentals Types growth/forcast/etc Percent Percent 2019 Reason/Rational growth model Total revenues Net Membership and other income Costs and expenses Cost of sales Operating, selling, general and administrative expenses Operating income Interest, net Debt Capital lease and financing obligations Interest income Loss on extinguishment of debt Unrealized gains and losses Income before income taxes Provision for income taxes Current Deferred Minority interest Income from continuing operations Income / loss from discontinued operations, net of income taxes Consolidated net income Consolidated net income attributable to noncontrolling interest Consolidated net income attributable to Walmart Per share Basic Continuing operations Discontinued operations Diluted Continuing operations Discontinued operations Weighted average shares Basic (M) Diluted (M) All figures in billions of U.S. Dollar except per share and labeled items. 31 JAN '17 12M 10-K (28 Mar '19) CS RECAP 2017 485.87 100.00% 481.32 99.06% 4.56 0.94% -463.11 -95.31% -361.26 -74.35% - 101.85 -20.96% 22.76 4.69% -2.27 -0.47% -2.04 -0.42% -0.32 -0.07% 0.10 0.02% 0.00 0.00% 0.00 0.00% 20.50 4.22% -6.20 -1.28% 0.00% 0.00% 0.00% 14.29 2.94% 0.00% 14.29 2.94% -0.65 -0.13% 13.64 2.81% 31 JAN '18 12M 10-K (28 Mar '19) CS RECAP 2018 500.34 100.00% 495.76 99.08% 4.58 0.92% -479.91 -95.92% -373.40 -74.63% - 106.51 -21.29% 20.44 4.08% -2.18 -0.44% -1.98 -0.40% -0.35 -0.07% 0.15 0.03% -3.14 -0.63% 0.00 0.00% 15.12 3.02% 4.60 -0.92% 0 0.00% 0 0.00% 0 0.00% 10.52 2.10% 0.00% 10.52 2. 10% -0.66 -0.13% 9.86 1.97% 31 JAN 19 12M 10-K (28 Mar '19) CS 2019 514.41 100.00% 510.33 99.21% 4.08 0.79% -492.45 -95.73% -385.30 -74.90% - 107.15 -20.83% 21.96 4.27% -2.13 -0.41% -1.98 -0.38% -0.37 -0.07% 0.22 0.04% 0.00 0.00% -8.37 -1.63% 11.46 2.23% 4.28 -0.83% 0 0.00% 0 0.00% 0 0.00% 7.18 1.40% 0 0.00% 7.18 1.40% -0.51 -0.10% 6.67 1.30% sum other expenses common size % of sales common size % of sales common size % of sales MATH why has it moved in this direction, needs research it it likely flat why has it moved in this direction, needs research it it likely flat Average = na na math function of the tax rate na na na 10k, earnings, they will talk about tax rate anf forcasted tax rate research) stays o math math math 4.40 3.29 2.28 4.38 3.28 2.26 3,101.0 3,112.0 2,995.0 3,010.0 2,929.0 2,945.0