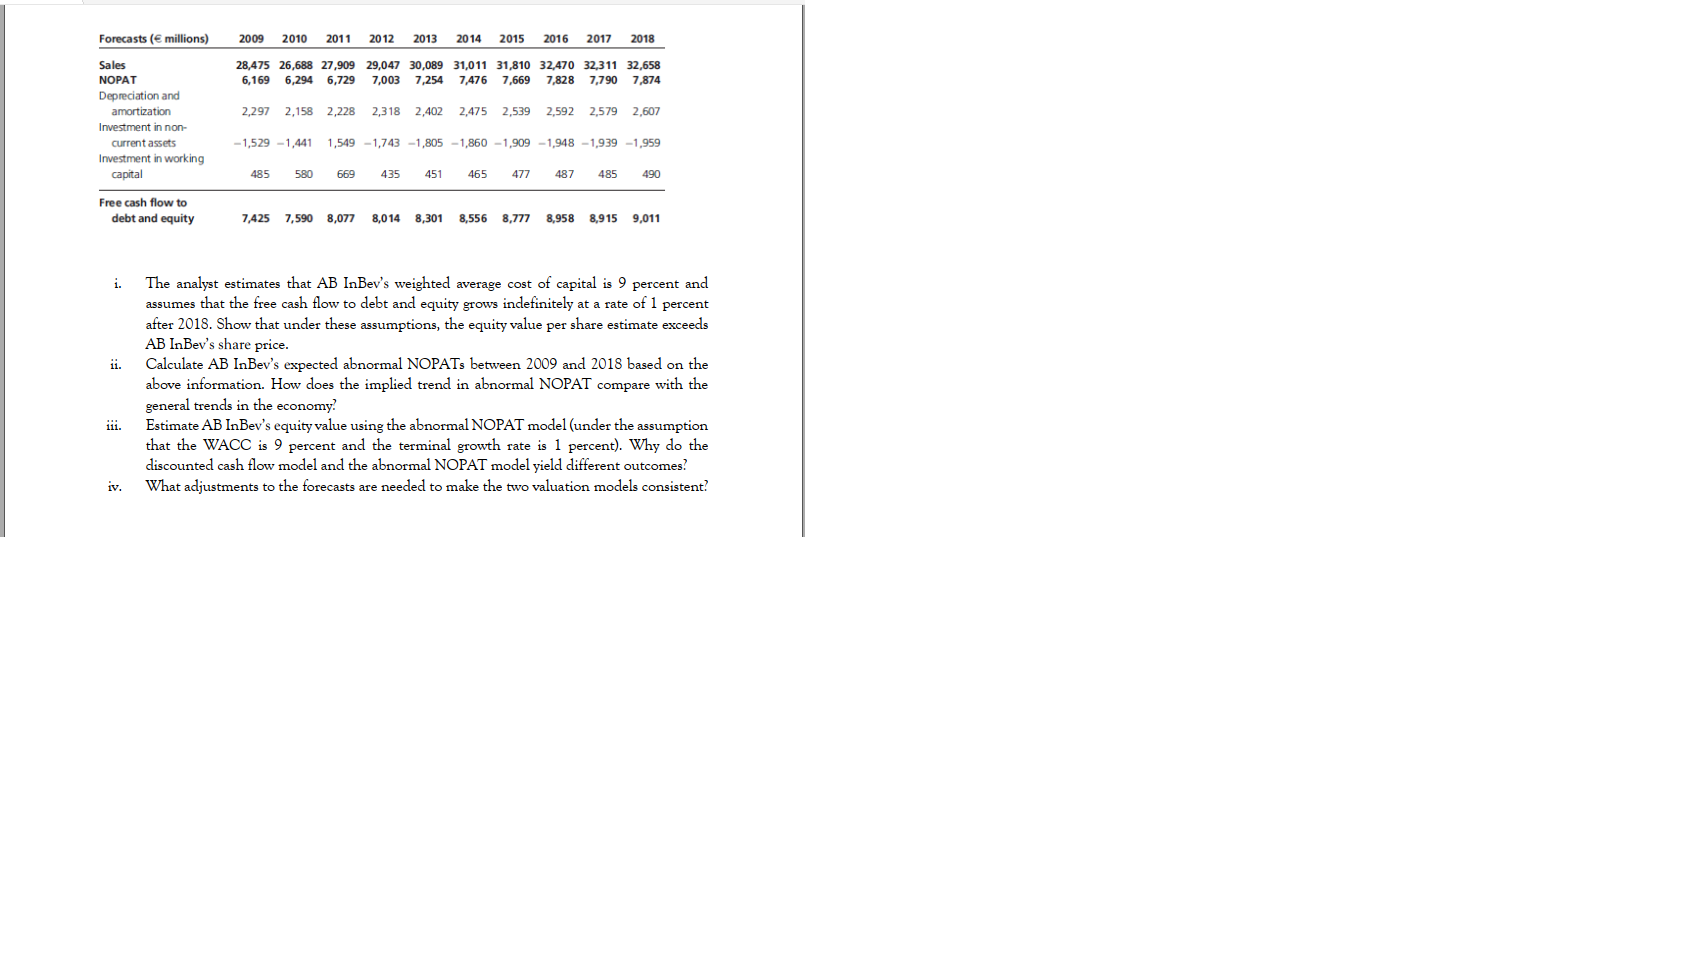
| Forecast | 2009 | 2010 | 2011 | 2012 | 2013 | 2014 | 2015 | 2016 | 2017 | 2018 |
| sale | 28,475 | 26,688 | 27,909 | 29,047 | 360,089 | 31,011 | 31,810 | 32,470 | 32,311 | 32,658 |
| NOPAT | 6,169 | 6,294 | 6,729 | 7,003 | 7,254 | 7,476 | 7,669 | 7,828 | 7,790 | 7,874 |
| Depreciation & Armotization | 2,297 | 2,158 | 2,228 | 2,318 | 2,402 | 2,475 | 2,539 | 2,592 | 2,579 | 2,607 |
| Investment in Non Current Assets | -1,529 | -1,441 | 1,549 | -1,743 | -1,805 | -1,860 | -1,909 | -1,948 | -1,939 | -1,959 |
| Investment in Working capital | 485 | 580 | 669 | 435 | 451 | 465 | 477 | 487 | 485 | 490 |
| Free Cash flow to debt to equity ratio | 7,425 | 7,590 | 8,077 | 8,014 | 8,301 | 8,556 | 8,777 | 8,958 | 8,915 | 9,011 |

Forecasts ( millions) 2009 2010 2011 2012 2013 2014 2015 2016 2017 2018 28,475 26,688 27,909 29,047 30,089 31,011 31,810 32,470 32,311 32,658 6,294 6,729 7,003 7,254 7,476 7,669 7,828 7,790 7,874 6,169 2.297 2,158 2,228 2,318 2,402 2,475 2,539 2,592 2,579 2,607 Sales NOPAT Depreciation and amortization Investment in non- current assets Investment in working capital - 1,529 -1,441 1,549 -1,743 -1,805 - 1,860 -1,909 -1,948 -1,939 -1,959 485 580 669 435 451 465 477 487 485 490 Free cash flow to debt and equity 7,425 7,590 8,077 8,014 8,301 8,556 8,777 8,958 8,915 9,011 i. . The analyst estimates that AB InBev's weighted average cost of capital is 9 percent and assumes that the free cash flow to debt and equity grows indefinitely at a rate of 1 percent after 2018. Show that under these assumptions, the equity value per share estimate exceeds AB InBev's share price. Calculate AB InBev's expected abnormal NOPATs between 2009 and 2018 based on the above information. How does the implied trend in abnormal NOPAT compare with the general trends in the economy Estimate AB InBev's equity value using the abnormal NOPAT model (under the assumption that the WACC is 9 percent and the terminal growth rate is 1 percent). Why do the discounted cash flow model and the abnormal NOPAT model yield different outcomes? What adjustments to the forecasts are needed to make the two valuation models consistent? iii. iv. Forecasts ( millions) 2009 2010 2011 2012 2013 2014 2015 2016 2017 2018 28,475 26,688 27,909 29,047 30,089 31,011 31,810 32,470 32,311 32,658 6,294 6,729 7,003 7,254 7,476 7,669 7,828 7,790 7,874 6,169 2.297 2,158 2,228 2,318 2,402 2,475 2,539 2,592 2,579 2,607 Sales NOPAT Depreciation and amortization Investment in non- current assets Investment in working capital - 1,529 -1,441 1,549 -1,743 -1,805 - 1,860 -1,909 -1,948 -1,939 -1,959 485 580 669 435 451 465 477 487 485 490 Free cash flow to debt and equity 7,425 7,590 8,077 8,014 8,301 8,556 8,777 8,958 8,915 9,011 i. . The analyst estimates that AB InBev's weighted average cost of capital is 9 percent and assumes that the free cash flow to debt and equity grows indefinitely at a rate of 1 percent after 2018. Show that under these assumptions, the equity value per share estimate exceeds AB InBev's share price. Calculate AB InBev's expected abnormal NOPATs between 2009 and 2018 based on the above information. How does the implied trend in abnormal NOPAT compare with the general trends in the economy Estimate AB InBev's equity value using the abnormal NOPAT model (under the assumption that the WACC is 9 percent and the terminal growth rate is 1 percent). Why do the discounted cash flow model and the abnormal NOPAT model yield different outcomes? What adjustments to the forecasts are needed to make the two valuation models consistent? iii. iv


