

Answered step by step
Verified Expert Solution
Question
1 Approved Answer
Forecast and Integrate Capex and D&A show formulas as well please not sure if you needed income statement but included it as well capex and
Forecast and Integrate Capex and D&A 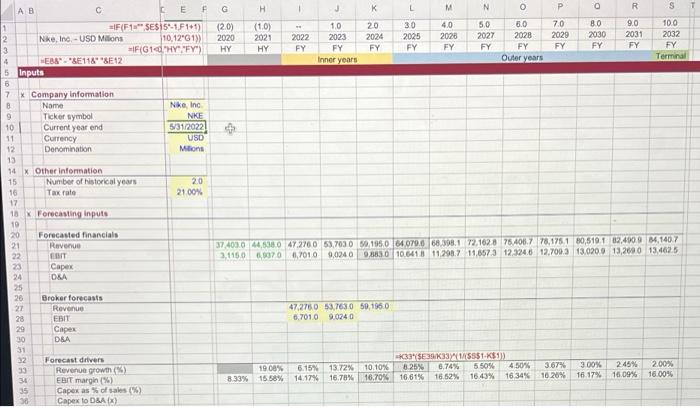
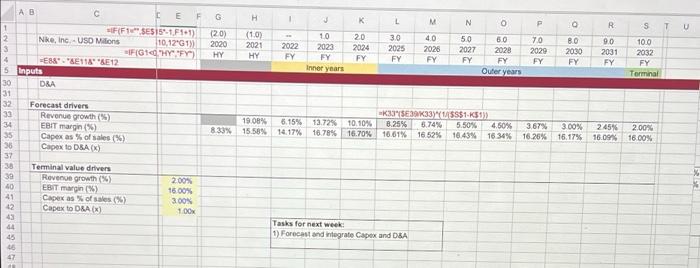
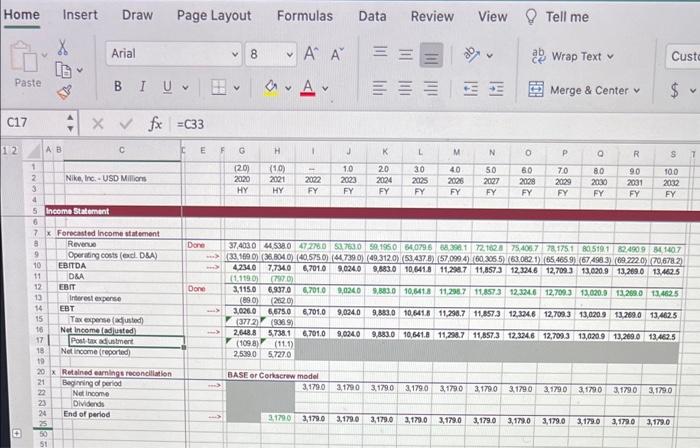
show formulas as well please
not sure if you needed income statement but included it as well
capex and d&a need to ne solved for each columns shown
Depreciation & Amortization
H 1 J K L M N o P R S AB C C E F G =FF1 SES 5-1,F11) (2.0) 2 Nike, Inc. - USD Milions 10.12"G1)) 2020 3 #IFGHYFY) HY 4 EBA.SE11&*&E12 5 Inputs (1.0) 2021 HY 2022 FY 10 2023 FY Inner years 20 2024 FY 30 2025 FY 4.0 2028 FY 50 2027 FY 3.0 2028 FY Outer years 70 2029 FY 2030 FY 9.0 2031 FY 10.0 2032 FY Terminal Nke, Inc NKE 5/31/2022 USD Milions 20 2100% 7 X Company Information B Name 9 Ticker symbol 10 Current year and 11 Currency 12 Denomination 13 14 x Other information 15 Number of storical years 16 Tax rate 17 18 Forecasting inputs 19 20 Forecasted financials 21 Revenge 22 23 Capex 24 DKA 25 26 Broker forecasts 27 Revenue 28 EBIT 29 Caper 30 DRA 31 12 Forecast drivers 93 Revenue growth (16) 34 EBIT margin (%) 35 Capex as of sales (%) 38 Capex to D&A 374030 480 47.2760 63.7030 50.1950 64070668.08.172.162.875,406.7 78,176.180,519.1 62.490 0 14,1407 3.1150 70 1,7010 9,0240 0.883.0 10.641811,298.7 11,657 3 12.324.6 12.700313,0200 13,269 0 13.4625 47.276.0 53.7630 50, 1950 6.7010 9,0240 1908% 15 58% 6.15% 14.17% *331533341/5551K5) 13.72% 10.10% 8.25% 6.74% 550% 4.50% 16.78% 16,70% 16.61% 16.52% 16.43% 16.34% 3.67% 300% 10.20% 16.17% 245% 16.09% 200% 16.00% 8.33% G H 1 L M N 0 P O R s T U (20) 2020 HY (1.0) 2021 HY 2022 FY 10 2023 FY Inner years 20 2024 FY 3.0 2025 FY 4.0 2028 FY 5.0 2027 FY 50 2028 FY Outer years 70 2029 FY 80 2030 FY 9.0 2031 FY 100 2032 FY Terminal DEA AB C E F 1 FF1 SESIS 1.F141) 2 Nike, Inc. - USD Milions 10,12G1) 3 IF(G10 HYFY) 4 EESS-UE114" E12 5 Inputs 30 31 32 Forecast drivers 33 Revenue growth (5) 34 EBIT margin%) 35 Capex as % of sales (%) 36 Capex to DBA 37 38 Terminal value drivers 39 Revenge growth (5) 200% 40 EBIT margin(96) 1600% 41 Capex as of sales (%) 3.00 12 Capex to D&A) 1.00 19.08% 6.15% 13.72 15.58% 14.17% 16.7845 SEK33 $S$1.53 10.10% 8.25% 5.74% 5.50% 4.50% 3.67% 16.70% 16.61% 16.52% 18.43% 16 34% 16.26% 8.33% 3.00% 16.17% 245% 16.09% 2007 16.00% &GAS 884&& Tasks for next week 1) Forecast and integrate Capex and DBA Home Insert Draw Page Layout Formulas Data Review View Tell me X Arial v 8 V ' ' == Wrap Text Custo Paste BIU a. Av = = = Merge & Center $ v C17 4 x fx =C33 12 AB C E G H 1 K M N 0 P Q R S 7 40 120 2020 HY (10) 2021 HY 2082 1.0 2023 FY 20 2024 FY 30 20025 FY 50 2027 FY 80 2029 FY 70 2029 FY 80 2000 FY 90 2031 FY 100 2032 FY FY FY Done 1 2 Nike Inc. - USD Millions 3 4 5 Income Statement 6 7x Forecasted Income statement 8 Revenue 9 Operating costs (ed. DIA) 10 EBITDA 11 DRA 12 EBIT 13 Interest expense 14 EBT 15 Tax expense (adjusted) 16 Net Income adjusted 17 Post tax adustment 18 Not income (reported Done 37,4030 4450 47 2780 $37530 5.1950 $4,0796 58.390 172 102 75408778.175105191 32.4909 1407 391000040 (40.575.0447390) 49312.083.437.357,099.600306563.002.1.165.465.91.6749836927201 706782) 4.234.0 7.7340 6,7010 9.024.0 9.883.0 10.641.8 11,298.7 11.8573 12.324.6 12,709.3 13.020,9 13,269.0 13.462.5 11.1190) (770) 3,115.0 6.837.0 6.7010 9,0240 9,883.0 10,618 11,298.7 11.8573 12.246 12700313,020.0 13.269.0124625 (890) (2020) 3,0260 6,675.0 6.701,0 9,0240 9.883.0 10.641.811,298.7 11.8573 12,324.6 12,7033 13,020.9 13.200.0 13.4625 (3772(9069 2,648.8 5.738.1 6,701.0 9.024.0 9.883.0 10,641.8 11,208.7 11,857.3 12,324.6 12,709.3 13,020 9 13,200.0 13.462.5 (1098) (11.1) 2,599.0 5.7270 BASE or Corkscrew model 3,1790 3,1790 3.1790 3,1790 3.1790 3.179.0 3.1790 3.17200 31730 3,1790 3,1790 20x Retained earnings reconciliation 21 Beginning a period Net Income 23 Dividends 24 End of period 25 21790 3,179.0 3.179.0 3.179.6 2,170.0 3,179.0 3.179.0 3.173.0 3.179.0 3.179.0 3,1730 3,179.0 H 1 J K L M N o P R S AB C C E F G =FF1 SES 5-1,F11) (2.0) 2 Nike, Inc. - USD Milions 10.12"G1)) 2020 3 #IFGHYFY) HY 4 EBA.SE11&*&E12 5 Inputs (1.0) 2021 HY 2022 FY 10 2023 FY Inner years 20 2024 FY 30 2025 FY 4.0 2028 FY 50 2027 FY 3.0 2028 FY Outer years 70 2029 FY 2030 FY 9.0 2031 FY 10.0 2032 FY Terminal Nke, Inc NKE 5/31/2022 USD Milions 20 2100% 7 X Company Information B Name 9 Ticker symbol 10 Current year and 11 Currency 12 Denomination 13 14 x Other information 15 Number of storical years 16 Tax rate 17 18 Forecasting inputs 19 20 Forecasted financials 21 Revenge 22 23 Capex 24 DKA 25 26 Broker forecasts 27 Revenue 28 EBIT 29 Caper 30 DRA 31 12 Forecast drivers 93 Revenue growth (16) 34 EBIT margin (%) 35 Capex as of sales (%) 38 Capex to D&A 374030 480 47.2760 63.7030 50.1950 64070668.08.172.162.875,406.7 78,176.180,519.1 62.490 0 14,1407 3.1150 70 1,7010 9,0240 0.883.0 10.641811,298.7 11,657 3 12.324.6 12.700313,0200 13,269 0 13.4625 47.276.0 53.7630 50, 1950 6.7010 9,0240 1908% 15 58% 6.15% 14.17% *331533341/5551K5) 13.72% 10.10% 8.25% 6.74% 550% 4.50% 16.78% 16,70% 16.61% 16.52% 16.43% 16.34% 3.67% 300% 10.20% 16.17% 245% 16.09% 200% 16.00% 8.33% G H 1 L M N 0 P O R s T U (20) 2020 HY (1.0) 2021 HY 2022 FY 10 2023 FY Inner years 20 2024 FY 3.0 2025 FY 4.0 2028 FY 5.0 2027 FY 50 2028 FY Outer years 70 2029 FY 80 2030 FY 9.0 2031 FY 100 2032 FY Terminal DEA AB C E F 1 FF1 SESIS 1.F141) 2 Nike, Inc. - USD Milions 10,12G1) 3 IF(G10 HYFY) 4 EESS-UE114" E12 5 Inputs 30 31 32 Forecast drivers 33 Revenue growth (5) 34 EBIT margin%) 35 Capex as % of sales (%) 36 Capex to DBA 37 38 Terminal value drivers 39 Revenge growth (5) 200% 40 EBIT margin(96) 1600% 41 Capex as of sales (%) 3.00 12 Capex to D&A) 1.00 19.08% 6.15% 13.72 15.58% 14.17% 16.7845 SEK33 $S$1.53 10.10% 8.25% 5.74% 5.50% 4.50% 3.67% 16.70% 16.61% 16.52% 18.43% 16 34% 16.26% 8.33% 3.00% 16.17% 245% 16.09% 2007 16.00% &GAS 884&& Tasks for next week 1) Forecast and integrate Capex and DBA Home Insert Draw Page Layout Formulas Data Review View Tell me X Arial v 8 V ' ' == Wrap Text Custo Paste BIU a. Av = = = Merge & Center $ v C17 4 x fx =C33 12 AB C E G H 1 K M N 0 P Q R S 7 40 120 2020 HY (10) 2021 HY 2082 1.0 2023 FY 20 2024 FY 30 20025 FY 50 2027 FY 80 2029 FY 70 2029 FY 80 2000 FY 90 2031 FY 100 2032 FY FY FY Done 1 2 Nike Inc. - USD Millions 3 4 5 Income Statement 6 7x Forecasted Income statement 8 Revenue 9 Operating costs (ed. DIA) 10 EBITDA 11 DRA 12 EBIT 13 Interest expense 14 EBT 15 Tax expense (adjusted) 16 Net Income adjusted 17 Post tax adustment 18 Not income (reported Done 37,4030 4450 47 2780 $37530 5.1950 $4,0796 58.390 172 102 75408778.175105191 32.4909 1407 391000040 (40.575.0447390) 49312.083.437.357,099.600306563.002.1.165.465.91.6749836927201 706782) 4.234.0 7.7340 6,7010 9.024.0 9.883.0 10.641.8 11,298.7 11.8573 12.324.6 12,709.3 13.020,9 13,269.0 13.462.5 11.1190) (770) 3,115.0 6.837.0 6.7010 9,0240 9,883.0 10,618 11,298.7 11.8573 12.246 12700313,020.0 13.269.0124625 (890) (2020) 3,0260 6,675.0 6.701,0 9,0240 9.883.0 10.641.811,298.7 11.8573 12,324.6 12,7033 13,020.9 13.200.0 13.4625 (3772(9069 2,648.8 5.738.1 6,701.0 9.024.0 9.883.0 10,641.8 11,208.7 11,857.3 12,324.6 12,709.3 13,020 9 13,200.0 13.462.5 (1098) (11.1) 2,599.0 5.7270 BASE or Corkscrew model 3,1790 3,1790 3.1790 3,1790 3.1790 3.179.0 3.1790 3.17200 31730 3,1790 3,1790 20x Retained earnings reconciliation 21 Beginning a period Net Income 23 Dividends 24 End of period 25 21790 3,179.0 3.179.0 3.179.6 2,170.0 3,179.0 3.179.0 3.173.0 3.179.0 3.179.0 3,1730 3,179.0 Step by Step Solution
There are 3 Steps involved in it
Step: 1

Get Instant Access to Expert-Tailored Solutions
See step-by-step solutions with expert insights and AI powered tools for academic success
Step: 2

Step: 3
Ace Your Homework with AI
Get the answers you need in no time with our AI-driven, step-by-step assistance
Get Started
Intermediate Accounting principles and analysis
Authors: Terry d. Warfield, jerry j. weygandt, Donald e. kieso
2nd Edition
471737933, 978-0471737933