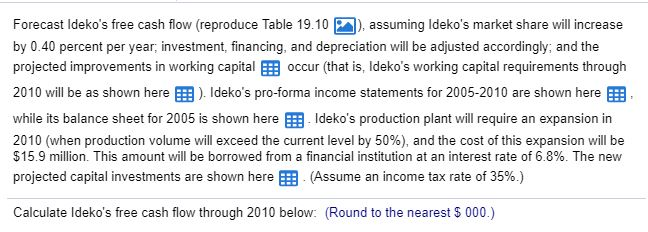
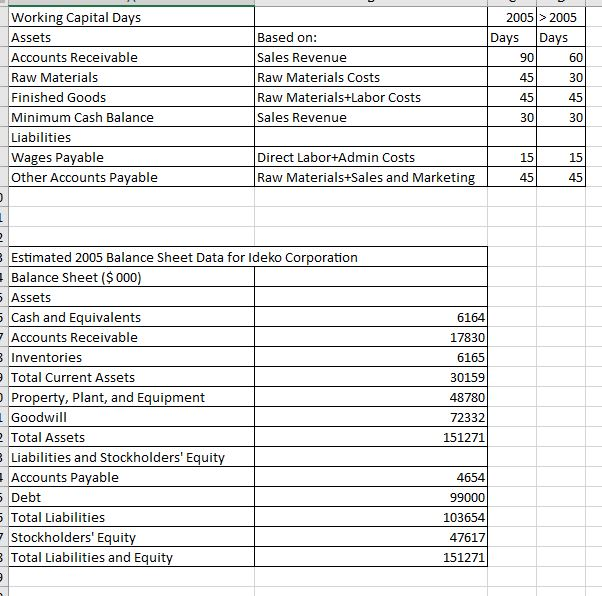
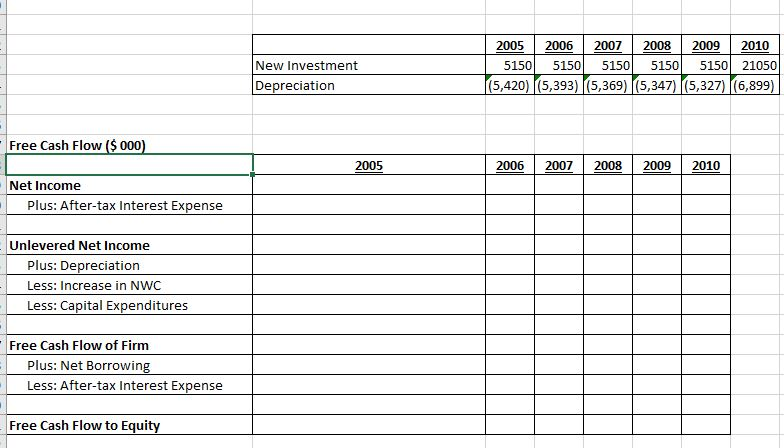
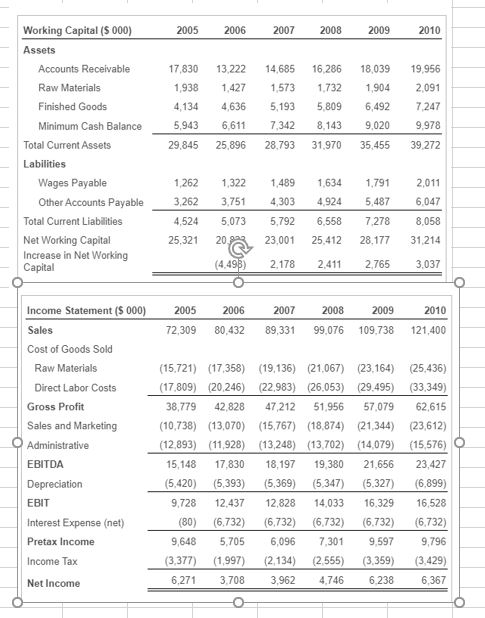
Forecast Ideko's free cash flow (reproduce Table 19.10 ), assuming Ideko's market share will increase by 0.40 percent per year, investment, financing, and depreciation will be adjusted accordingly, and the projected improvements in working capital occur (that is, Ideko's working capital requirements through 2010 will be as shown here ). Ideko's pro-forma income statements for 2005-2010 are shown here while its balance sheet for 2005 is shown here : Ideko's production plant will require an expansion in 2010 (when production volume will exceed the current level by 50%), and the cost of this expansion will be $15.9 million. This amount will be borrowed from a financial institution at an interest rate of 6.8%. The new projected capital investments are shown here (Assume an income tax rate of 35%.) Calculate Ideko's free cash flow through 2010 below: (Round to the nearest $ 000.) 2005 > 2005 Days Days Working Capital Days Assets Accounts Receivable Raw Materials Finished Goods Minimum Cash Balance Liabilities Wages Payable Other Accounts Payable Based on: Sales Revenue Raw Materials Costs Raw Materials+Labor Costs Sales Revenue Aw Direct Labor+Admin Costs Raw Materials+Sales and Marketing Estimated 2005 Balance Sheet Data for Ideko Corporation Balance Sheet($ 000) 5 Assets 5 Cash and Equivalents - Accounts Receivable 3 Inventories Total Current Assets Property, plant, and Equipment Goodwill 2 Total Assets Liabilities and Stockholders' Equity Accounts Payable 5 Debt 5 Total Liabilities - Stockholders' Equity 3 Total Liabilities and Equity 6164 17830 6165 30159 48780 72332 151271 4654 99000 103654 47617 151271 New Investment Depreciation 2005 2006 2007 2008 2009 2010 5150 5150 5150 5150 5150 21050|| (5,420) (5,393) (5,369) (5,347) (5,327) (6,899) Free Cash Flow ($ 000) 2005 2006 2007 2008 2009 2010 Net Income Plus: After-tax Interest Expense Unlevered Net Income Plus: Depreciation Less: Increase in NWC Less: Capital Expenditures Free Cash Flow of Firm Plus: Net Borrowing Less: After-tax Interest Expense Free Cash Flow to Equity 2005 2006 2007 2008 2009 2010 Working Capital (S 000) Assets Accounts Receivable Raw Materials Finished Goods Minimum Cash Balance Total Current Assets Labilities Wages Payable Other Accounts Payable Total Current Liabilities Net Working Capital Increase in Net Working Capital 17,830 13.222 14.685 16,286 1,938 1,427 1.573 1,732 4.134 4.636 5.1935,809 5.9436,6117,342 8,143 29,845 25,896 28.793 31.970 18,039 1,904 6,492 9,020 35,455 1 9,956 2,091 7.247 9.978 39,272 6 1,262 3,262 4,524 25,321 1,322 3,751 5,073 2003 (4.495) 1,4891 634 4,303 4.924 5 ,792 6,558 23,001 25,412 2.178 2,411 1,791 5,487 7.278 28,177 2,765 2011 ,047 8,058 31,214 3,037 2005 72,309 2006 80.432 2007 89,331 2008 99,076 2009 109,738 2010 121,400 Income Statement (8 000) Sales Cost of Goods Sold Raw Materials Direct Labor Costs Gross Profit Sales and Marketing Administrative EBITDA Depreciation EBIT Interest Expense (net) Pretax Income (15.721) (17.358) (17,809) (20,246) 38,779 42.828 (10,738) (13,070) (12.893) (11.928) 15,148 17,830 (5.420) (5,393) 9,728 12.437 (80) (6,732) 9,648 5,705 (3.377) (1.997) 6.271 3,708 (19,136) (21.067) (23.164) (25,436) (22.983) (26,053) (29.495) (33,349) 47,212 51,956 57,079 62,615 (15,767) (18,874) (21,344) (23,612) (13,248) (13702) (14.079) (15,576) O 18,197 19,380 21,656 23,427 5,369) (5.347) (5.327) (6.899) 12,828 14,033 16,329 16,528 (6.732) (6.732) (6.732) (6.732) 6,096 7.301 9.597 9,796 (2.134) (2.555) (3.359) (3.429) 3,962 4.74662386,367 Income Tax Net Income Forecast Ideko's free cash flow (reproduce Table 19.10 ), assuming Ideko's market share will increase by 0.40 percent per year, investment, financing, and depreciation will be adjusted accordingly, and the projected improvements in working capital occur (that is, Ideko's working capital requirements through 2010 will be as shown here ). Ideko's pro-forma income statements for 2005-2010 are shown here while its balance sheet for 2005 is shown here : Ideko's production plant will require an expansion in 2010 (when production volume will exceed the current level by 50%), and the cost of this expansion will be $15.9 million. This amount will be borrowed from a financial institution at an interest rate of 6.8%. The new projected capital investments are shown here (Assume an income tax rate of 35%.) Calculate Ideko's free cash flow through 2010 below: (Round to the nearest $ 000.) 2005 > 2005 Days Days Working Capital Days Assets Accounts Receivable Raw Materials Finished Goods Minimum Cash Balance Liabilities Wages Payable Other Accounts Payable Based on: Sales Revenue Raw Materials Costs Raw Materials+Labor Costs Sales Revenue Aw Direct Labor+Admin Costs Raw Materials+Sales and Marketing Estimated 2005 Balance Sheet Data for Ideko Corporation Balance Sheet($ 000) 5 Assets 5 Cash and Equivalents - Accounts Receivable 3 Inventories Total Current Assets Property, plant, and Equipment Goodwill 2 Total Assets Liabilities and Stockholders' Equity Accounts Payable 5 Debt 5 Total Liabilities - Stockholders' Equity 3 Total Liabilities and Equity 6164 17830 6165 30159 48780 72332 151271 4654 99000 103654 47617 151271 New Investment Depreciation 2005 2006 2007 2008 2009 2010 5150 5150 5150 5150 5150 21050|| (5,420) (5,393) (5,369) (5,347) (5,327) (6,899) Free Cash Flow ($ 000) 2005 2006 2007 2008 2009 2010 Net Income Plus: After-tax Interest Expense Unlevered Net Income Plus: Depreciation Less: Increase in NWC Less: Capital Expenditures Free Cash Flow of Firm Plus: Net Borrowing Less: After-tax Interest Expense Free Cash Flow to Equity 2005 2006 2007 2008 2009 2010 Working Capital (S 000) Assets Accounts Receivable Raw Materials Finished Goods Minimum Cash Balance Total Current Assets Labilities Wages Payable Other Accounts Payable Total Current Liabilities Net Working Capital Increase in Net Working Capital 17,830 13.222 14.685 16,286 1,938 1,427 1.573 1,732 4.134 4.636 5.1935,809 5.9436,6117,342 8,143 29,845 25,896 28.793 31.970 18,039 1,904 6,492 9,020 35,455 1 9,956 2,091 7.247 9.978 39,272 6 1,262 3,262 4,524 25,321 1,322 3,751 5,073 2003 (4.495) 1,4891 634 4,303 4.924 5 ,792 6,558 23,001 25,412 2.178 2,411 1,791 5,487 7.278 28,177 2,765 2011 ,047 8,058 31,214 3,037 2005 72,309 2006 80.432 2007 89,331 2008 99,076 2009 109,738 2010 121,400 Income Statement (8 000) Sales Cost of Goods Sold Raw Materials Direct Labor Costs Gross Profit Sales and Marketing Administrative EBITDA Depreciation EBIT Interest Expense (net) Pretax Income (15.721) (17.358) (17,809) (20,246) 38,779 42.828 (10,738) (13,070) (12.893) (11.928) 15,148 17,830 (5.420) (5,393) 9,728 12.437 (80) (6,732) 9,648 5,705 (3.377) (1.997) 6.271 3,708 (19,136) (21.067) (23.164) (25,436) (22.983) (26,053) (29.495) (33,349) 47,212 51,956 57,079 62,615 (15,767) (18,874) (21,344) (23,612) (13,248) (13702) (14.079) (15,576) O 18,197 19,380 21,656 23,427 5,369) (5.347) (5.327) (6.899) 12,828 14,033 16,329 16,528 (6.732) (6.732) (6.732) (6.732) 6,096 7.301 9.597 9,796 (2.134) (2.555) (3.359) (3.429) 3,962 4.74662386,367 Income Tax Net Income