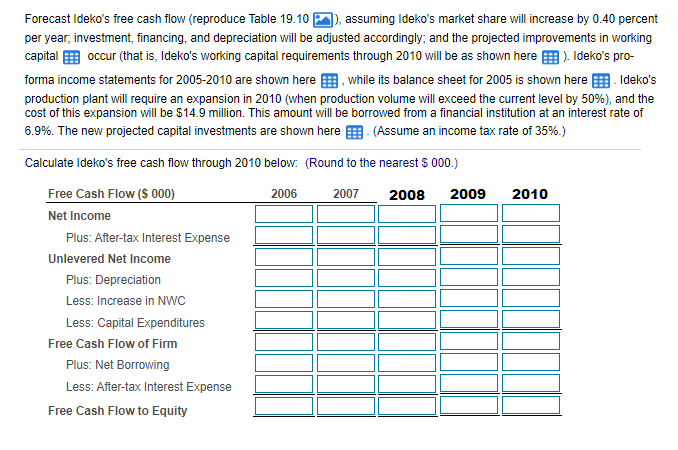
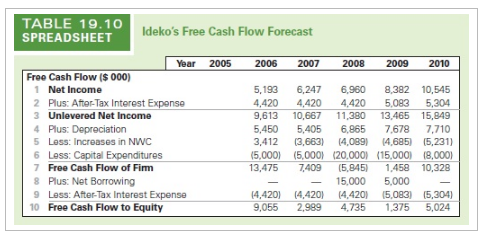
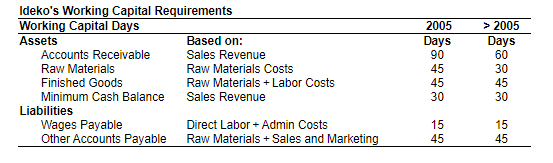
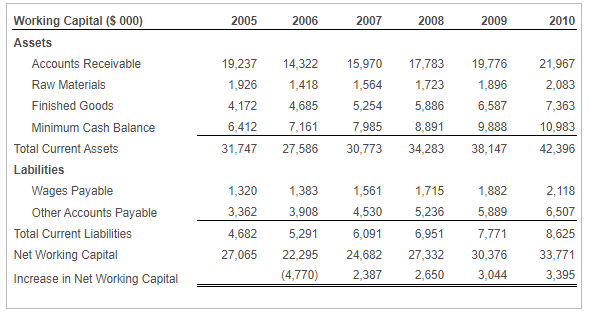
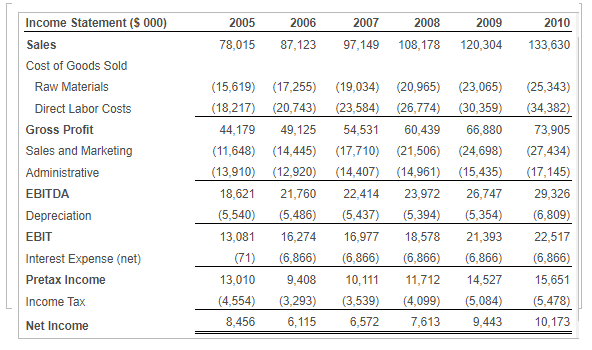
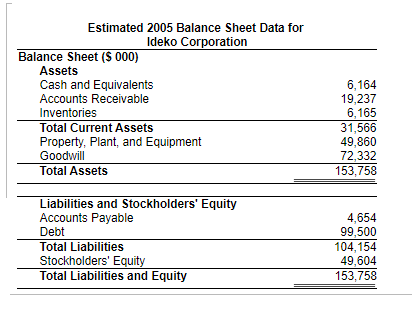
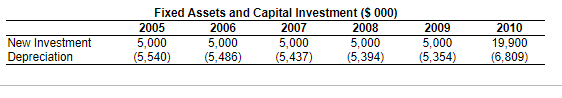
Forecast Ideko's free cash flow (reproduce Table 19.10 ]), assuming Ideko's market share will increase by 0.40 percent per year, investment, financing, and depreciation will be adjusted accordingly, and the projected improvements in working capital occur (that is, Ideko's working capital requirements through 2010 will be as shown here ). Ideko's pro- forma income statements for 2005-2010 are shown here while its balance sheet for 2005 is shown here Bldeko's production plant will require an expansion in 2010 (when production volume will exceed the current level by 50%), and the cost of this expansion will be $14.9 million. This amount will be borrowed from a financial institution at an interest rate of 6.9%. The new projected capital investments are shown here (Assume an income tax rate of 35%.) Calculate Ideko's free cash flow through 2010 below. (Round to the nearest $ 000.) 2006 2007 2008 2009 2010 Free Cash Flow (S 000) Net Income Plus: After-tax Interest Expense Unlevered Net Income Plus: Depreciation Less: Increase in NWC Less: Capital Expenditures Free Cash Flow of Firm Plus: Net Borrowing Less: After-tax Interest Expense Free Cash Flow to Equity TABLE 19.10 SPREADSHEET Ideko's Free Cash Flow Forecast Year 2005 2006 2007 2008 2009 2010 Free Cash Flow ($ 000) 1 Net Income 5,193 6,247 6.960 8,382 10,545 2 Plus: After-Tax Interest Expense 4,420 4,420 4,420 5.083 5,304 3 Unlevered Net Income 9,613 10,667 11,380 13,465 15,849 4 Plus: Depreciation 5,450 5,405 6.865 7.678 7,710 5 Less: Increases in NWC 3,412 (3,663) (4,089) 14,685) (5,231) 6 Less: Capital Expenditures (5,000) (5,000) (20,000) (15,000) 18,000) 7 Free Cash Flow of Firm 13,475 7,409 (5.845) 1.458 10,328 8 Plus: Net Borrowing 15,000 5,000 9 Less: After-Tax Interest Expense 14,4201 (4,420) (4.420) (5.083) (5,304) 10 Free Cash Flow to Equity 9,055 2,989 4.735 1.375 5,024 > 2005 Days 60 Ideko's Working Capital Requirements Working Capital Days Assets Based on: Accounts Receivable Sales Revenue Raw Materials Raw Materials Costs Finished Goods Raw Materials + Labor Costs Minimum Cash Balance Sales Revenue Liabilities Wages Payable Direct Labor + Admin Costs Other Accounts Payable Raw Materials + Sales and Marketing 2005 Days 90 45 45 30 30 45 30 15 45 15 45 2005 2006 2007 2008 2009 2010 Working Capital (3 000) Assets Accounts Receivable Raw Materials Finished Goods Minimum Cash Balance Total Current Assets Labilities Wages Payable Other Accounts Payable Total Current Liabilities Net Working Capital Increase in Net Working Capital 19,237 1,926 4,172 6,412 31,747 14,322 1,418 4,685 7,161 27,586 15,970 1,564 5,254 7,985 30,773 17,783 1,723 5,886 8,891 34,283 19,776 1,896 6,587 9,888 38,147 21,967 2,083 7,363 10,983 42,396 1,383 1,882 3,908 5,889 1,320 3,362 4,682 27,065 5,291 22.295 (4,770) 1,561 4,530 6,091 24,682 2,387 1,715 5,236 6,951 27,332 2,650 7,771 30,376 3,044 2,118 6,507 8,625 33,771 3,395 2008 2009 2010 2005 78,015 2006 87,123 2007 97,149 108,178 120,304 133,630 Income Statement ($ 000) Sales Cost of Goods Sold Raw Materials Direct Labor Costs Gross Profit Sales and Marketing Administrative EBITDA Depreciation EBIT Interest Expense (net) Pretax Income Income Tax (15,619) (17,255) (19,034) (20,965) (23,065) (18,217) (20,743) (23,584) (26,774) (30,359) 44,179 49, 125 54,531 60,439 66,880 (11,648) (14,445) (17,710) (21,506) (24,698) (13,910) (12,920) (14,407) (14,961) (15,435) 18,621 21,760 22,414 23,972 26,747 (5,540) (5,486) (5,437) (5,394) (5,354) 13,081 16,274 16,977 18,578 21,393 (71) (6,866) (6,866) (6,866) (6,866) 13,010 9,408 10,111 11,712 14,527 (4,554) (3,293) (3,539) (4,099) (5,084) 8,456 6,115 6,572 7,613 9,443 (25,343) (34,382) 73,905 (27,434) (17,145) 29,326 (6,809) 22,517 (6,866) 15,651 (5,478) 10,173 Net Income Estimated 2005 Balance Sheet Data for Ideko Corporation Balance Sheet ($ 000) Assets Cash and Equivalents Accounts Receivable Inventories Total Current Assets Property, Plant, and Equipment Goodwill Total Assets 6,164 19,237 6,165 31,566 49,860 72,332 153,758 Liabilities and Stockholders' Equity Accounts Payable Debt Total Liabilities Stockholders' Equity Total Liabilities and Equity 4,654 99,500 104,154 49,604 153,758 Fixed Assets and Capital Investment ($ 000) 2005 2006 2007 2008 5,000 5,000 5,000 5,000 (5,540) (5,486) (5,437) (5,394) New Investment Depreciation 2009 5.000 (5,354) 2010 19,900 (6,809) Forecast Ideko's free cash flow (reproduce Table 19.10 ]), assuming Ideko's market share will increase by 0.40 percent per year, investment, financing, and depreciation will be adjusted accordingly, and the projected improvements in working capital occur (that is, Ideko's working capital requirements through 2010 will be as shown here ). Ideko's pro- forma income statements for 2005-2010 are shown here while its balance sheet for 2005 is shown here Bldeko's production plant will require an expansion in 2010 (when production volume will exceed the current level by 50%), and the cost of this expansion will be $14.9 million. This amount will be borrowed from a financial institution at an interest rate of 6.9%. The new projected capital investments are shown here (Assume an income tax rate of 35%.) Calculate Ideko's free cash flow through 2010 below. (Round to the nearest $ 000.) 2006 2007 2008 2009 2010 Free Cash Flow (S 000) Net Income Plus: After-tax Interest Expense Unlevered Net Income Plus: Depreciation Less: Increase in NWC Less: Capital Expenditures Free Cash Flow of Firm Plus: Net Borrowing Less: After-tax Interest Expense Free Cash Flow to Equity TABLE 19.10 SPREADSHEET Ideko's Free Cash Flow Forecast Year 2005 2006 2007 2008 2009 2010 Free Cash Flow ($ 000) 1 Net Income 5,193 6,247 6.960 8,382 10,545 2 Plus: After-Tax Interest Expense 4,420 4,420 4,420 5.083 5,304 3 Unlevered Net Income 9,613 10,667 11,380 13,465 15,849 4 Plus: Depreciation 5,450 5,405 6.865 7.678 7,710 5 Less: Increases in NWC 3,412 (3,663) (4,089) 14,685) (5,231) 6 Less: Capital Expenditures (5,000) (5,000) (20,000) (15,000) 18,000) 7 Free Cash Flow of Firm 13,475 7,409 (5.845) 1.458 10,328 8 Plus: Net Borrowing 15,000 5,000 9 Less: After-Tax Interest Expense 14,4201 (4,420) (4.420) (5.083) (5,304) 10 Free Cash Flow to Equity 9,055 2,989 4.735 1.375 5,024 > 2005 Days 60 Ideko's Working Capital Requirements Working Capital Days Assets Based on: Accounts Receivable Sales Revenue Raw Materials Raw Materials Costs Finished Goods Raw Materials + Labor Costs Minimum Cash Balance Sales Revenue Liabilities Wages Payable Direct Labor + Admin Costs Other Accounts Payable Raw Materials + Sales and Marketing 2005 Days 90 45 45 30 30 45 30 15 45 15 45 2005 2006 2007 2008 2009 2010 Working Capital (3 000) Assets Accounts Receivable Raw Materials Finished Goods Minimum Cash Balance Total Current Assets Labilities Wages Payable Other Accounts Payable Total Current Liabilities Net Working Capital Increase in Net Working Capital 19,237 1,926 4,172 6,412 31,747 14,322 1,418 4,685 7,161 27,586 15,970 1,564 5,254 7,985 30,773 17,783 1,723 5,886 8,891 34,283 19,776 1,896 6,587 9,888 38,147 21,967 2,083 7,363 10,983 42,396 1,383 1,882 3,908 5,889 1,320 3,362 4,682 27,065 5,291 22.295 (4,770) 1,561 4,530 6,091 24,682 2,387 1,715 5,236 6,951 27,332 2,650 7,771 30,376 3,044 2,118 6,507 8,625 33,771 3,395 2008 2009 2010 2005 78,015 2006 87,123 2007 97,149 108,178 120,304 133,630 Income Statement ($ 000) Sales Cost of Goods Sold Raw Materials Direct Labor Costs Gross Profit Sales and Marketing Administrative EBITDA Depreciation EBIT Interest Expense (net) Pretax Income Income Tax (15,619) (17,255) (19,034) (20,965) (23,065) (18,217) (20,743) (23,584) (26,774) (30,359) 44,179 49, 125 54,531 60,439 66,880 (11,648) (14,445) (17,710) (21,506) (24,698) (13,910) (12,920) (14,407) (14,961) (15,435) 18,621 21,760 22,414 23,972 26,747 (5,540) (5,486) (5,437) (5,394) (5,354) 13,081 16,274 16,977 18,578 21,393 (71) (6,866) (6,866) (6,866) (6,866) 13,010 9,408 10,111 11,712 14,527 (4,554) (3,293) (3,539) (4,099) (5,084) 8,456 6,115 6,572 7,613 9,443 (25,343) (34,382) 73,905 (27,434) (17,145) 29,326 (6,809) 22,517 (6,866) 15,651 (5,478) 10,173 Net Income Estimated 2005 Balance Sheet Data for Ideko Corporation Balance Sheet ($ 000) Assets Cash and Equivalents Accounts Receivable Inventories Total Current Assets Property, Plant, and Equipment Goodwill Total Assets 6,164 19,237 6,165 31,566 49,860 72,332 153,758 Liabilities and Stockholders' Equity Accounts Payable Debt Total Liabilities Stockholders' Equity Total Liabilities and Equity 4,654 99,500 104,154 49,604 153,758 Fixed Assets and Capital Investment ($ 000) 2005 2006 2007 2008 5,000 5,000 5,000 5,000 (5,540) (5,486) (5,437) (5,394) New Investment Depreciation 2009 5.000 (5,354) 2010 19,900 (6,809)


