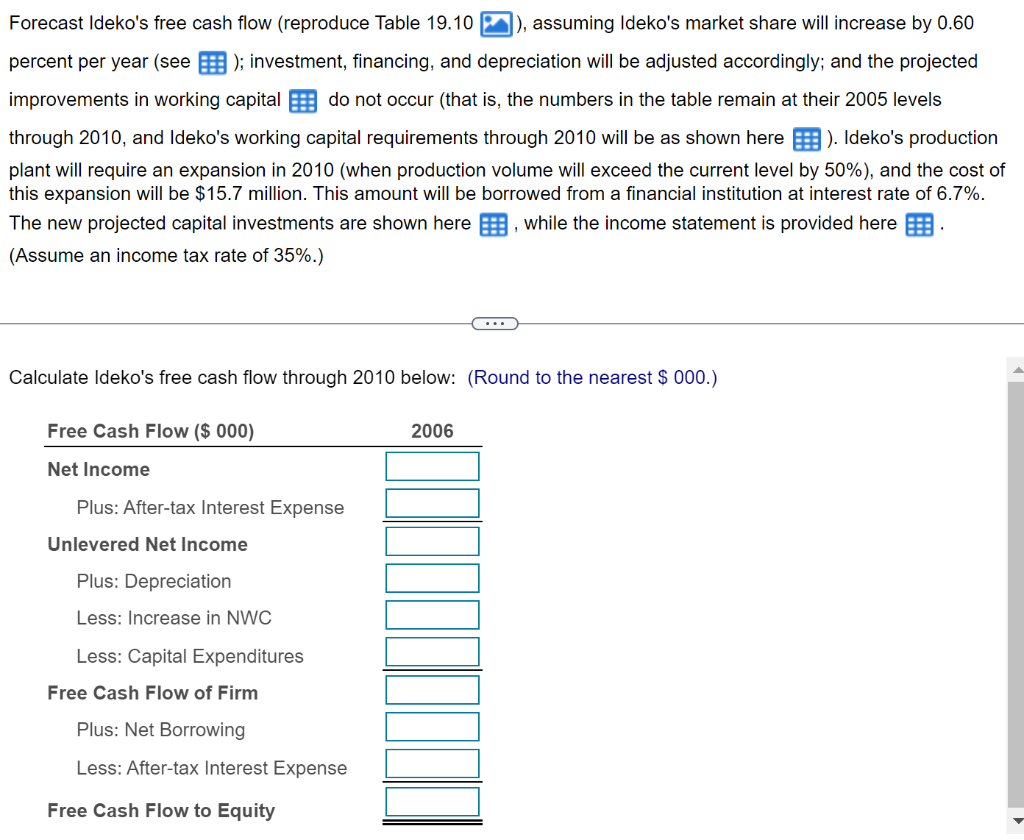
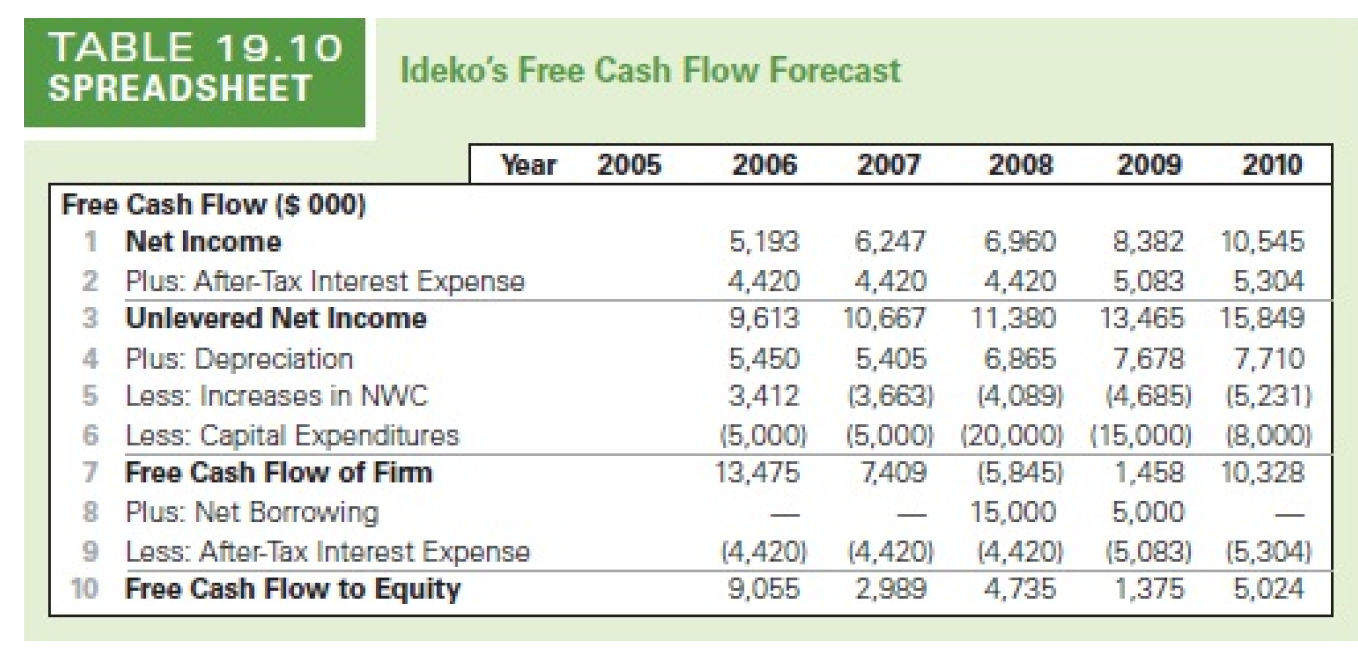
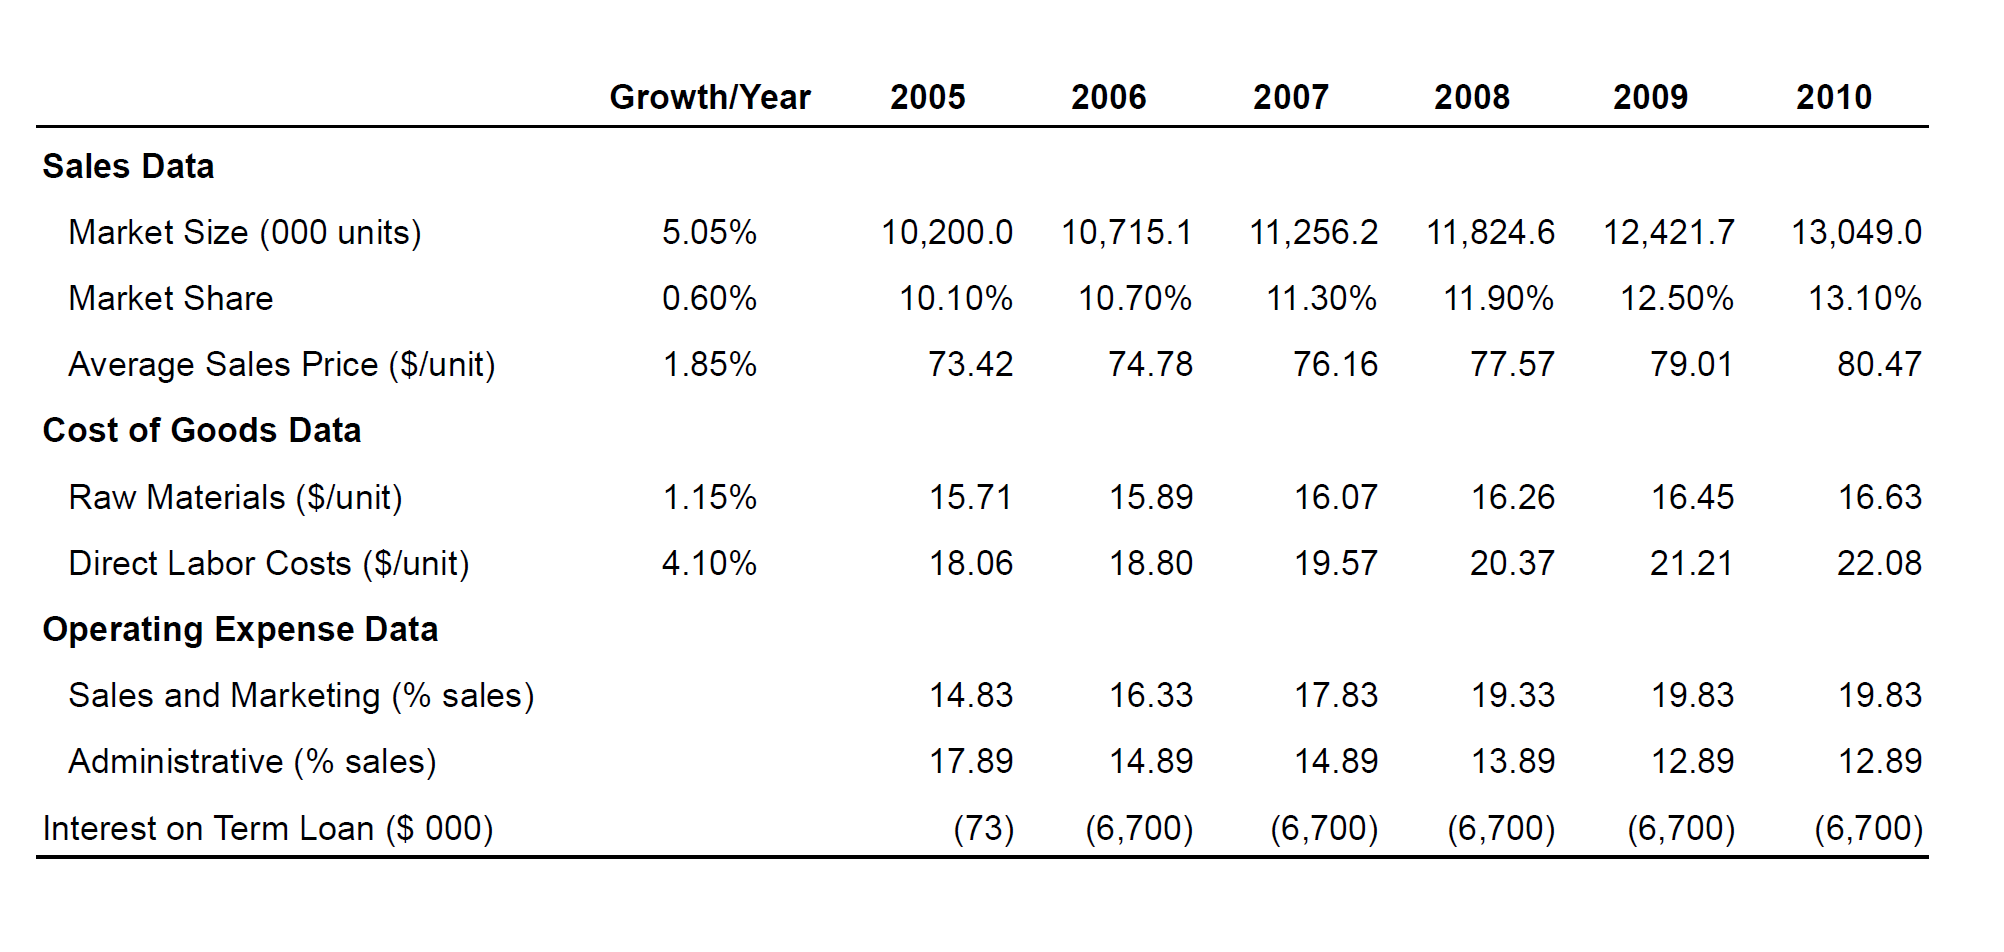
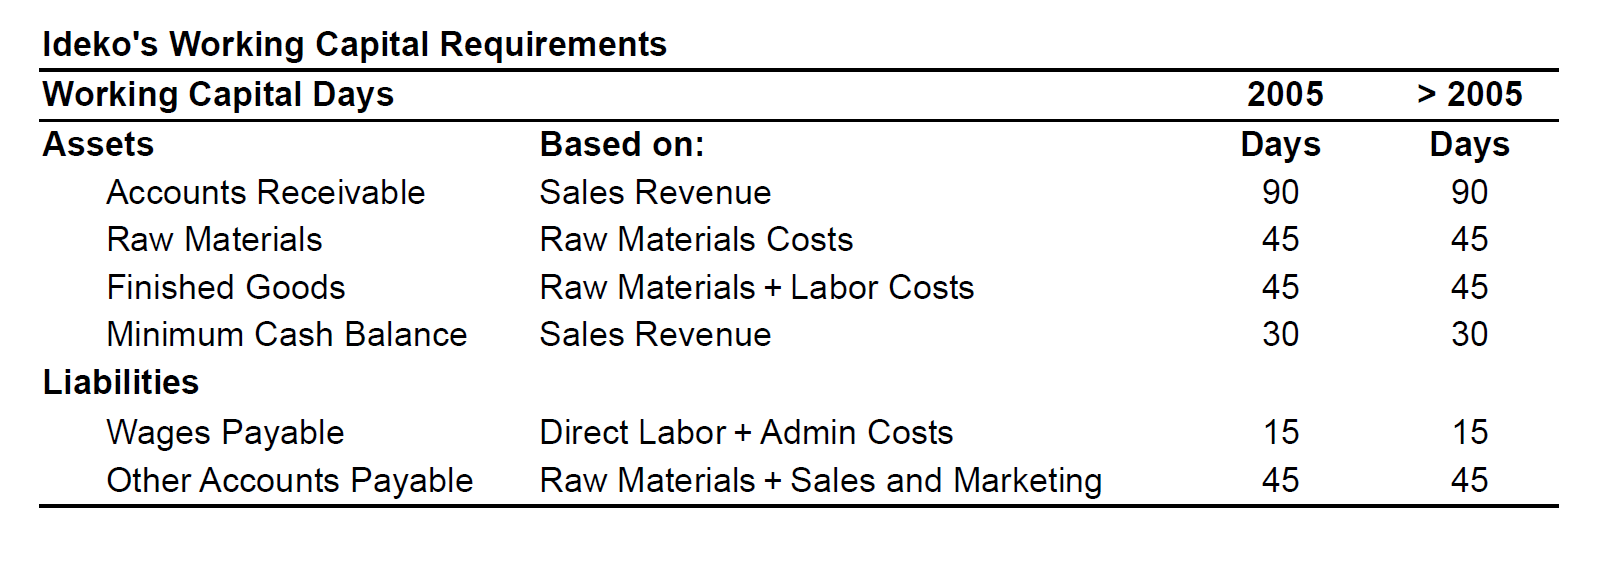
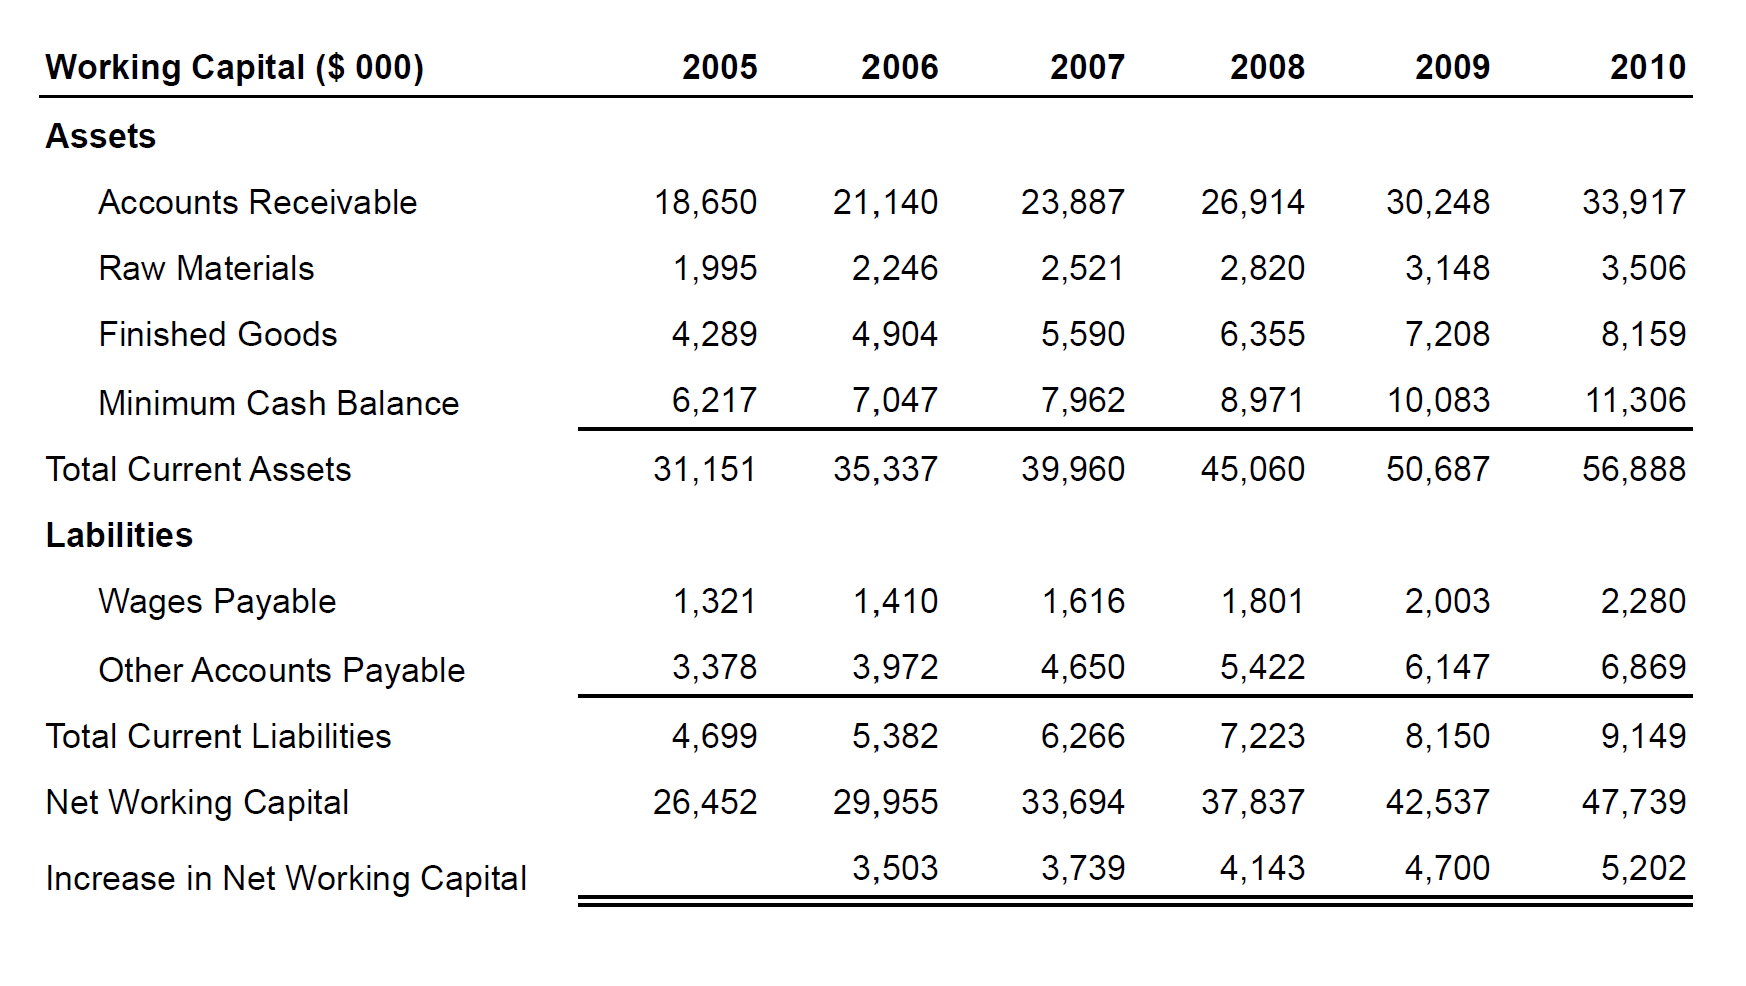

Forecast Ideko's free cash flow (reproduce Table 19.10 ), assuming Ideko's market share will increase by 0.60 percent per year (see _ ); investment, financing, and depreciation will be adjusted accordingly; and the projected improvements in working capital do not occur (that is, the numbers in the table remain at their 2005 levels through 2010, and Ideko's working capital requirements through 2010 will be as shown here ). Ideko's production plant will require an expansion in 2010 (when production volume will exceed the current level by 50% ), and the cost 0 this expansion will be $15.7 million. This amount will be borrowed from a financial institution at interest rate of 6.7%. The new projected capital investments are shown here , while the income statement is provided here (Assume an income tax rate of 35%.) Calculate Ideko's free cash flow through 2010 below: (Round to the nearest $000.) TABLE 19.10 SPREADSHEET Ideko's Free Cash Flow Forecast Ideko's Working Capital Requirements \begin{tabular}{llcc} \hline Working Capital Days & & 2005 & >2005 \\ \hline Assets & Based on: & Days & Days \\ Accounts Receivable & Sales Revenue & 90 & 90 \\ Raw Materials & Raw Materials Costs & 45 & 45 \\ Finished Goods & Raw Materials + Labor Costs & 45 & 45 \\ Minimum Cash Balance & Sales Revenue & 30 & 30 \\ Liabilities & & & \\ Wages Payable & Direct Labor + Admin Costs & 15 & 15 \\ Other Accounts Payable & Raw Materials + Sales and Marketing & 45 & 45 \\ \hline \end{tabular} \begin{tabular}{lrrrrrrr} Working Capital (\$ 000) & 2005 & 2006 & 2007 & 2008 & 2009 & 2010 \\ \hline Assets & & & & & & & \\ Accounts Receivable & 18,650 & 21,140 & 23,887 & 26,914 & 30,248 & 33,917 \\ Raw Materials & 1,995 & 2,246 & 2,521 & 2,820 & 3,148 & 3,506 \\ Finished Goods & 4,289 & 4,904 & 5,590 & 6,355 & 7,208 & 8,159 \\ Minimum Cash Balance & 6,217 & 7,047 & 7,962 & 8,971 & 10,083 & 11,306 \\ \cline { 2 - 7 } & 31,151 & 35,337 & 39,960 & 45,060 & 50,687 & 56,888 \\ Total Current Assets & & & & & & \\ Labilities & 1,321 & 1,410 & 1,616 & 1,801 & 2,003 & 2,280 \\ Wages Payable & 3,378 & 3,972 & 4,650 & 5,422 & 6,147 & 6,869 \\ Other Accounts Payable & 4,699 & 5,382 & 6,266 & 7,223 & 8,150 & 9,149 \\ Total Current Liabilities & 26,452 & 29,955 & 33,694 & 37,837 & 42,537 & 47,739 \\ Net Working Capital & & 3,503 & 3,739 & 4,143 & 4,700 & 5,202 \\ Increase in Net Working Capital & & & & & \end{tabular} Fixed Assets and Capital Investment ($000) \begin{tabular}{lcccccc} \hline & 2005 & 2006 & 2007 & 2008 & 2009 & 2010 \\ \hline New Investment & 5,000 & 5,000 & 5,000 & 5,000 & 5,000 & 20,700 \\ Depreciation & (5,540) & (5,486) & (5,437) & (5,394) & (5,354) & (6,889) \\ \hline \end{tabular} Forecast Ideko's free cash flow (reproduce Table 19.10 ), assuming Ideko's market share will increase by 0.60 percent per year (see _ ); investment, financing, and depreciation will be adjusted accordingly; and the projected improvements in working capital do not occur (that is, the numbers in the table remain at their 2005 levels through 2010, and Ideko's working capital requirements through 2010 will be as shown here ). Ideko's production plant will require an expansion in 2010 (when production volume will exceed the current level by 50% ), and the cost 0 this expansion will be $15.7 million. This amount will be borrowed from a financial institution at interest rate of 6.7%. The new projected capital investments are shown here , while the income statement is provided here (Assume an income tax rate of 35%.) Calculate Ideko's free cash flow through 2010 below: (Round to the nearest $000.) TABLE 19.10 SPREADSHEET Ideko's Free Cash Flow Forecast Ideko's Working Capital Requirements \begin{tabular}{llcc} \hline Working Capital Days & & 2005 & >2005 \\ \hline Assets & Based on: & Days & Days \\ Accounts Receivable & Sales Revenue & 90 & 90 \\ Raw Materials & Raw Materials Costs & 45 & 45 \\ Finished Goods & Raw Materials + Labor Costs & 45 & 45 \\ Minimum Cash Balance & Sales Revenue & 30 & 30 \\ Liabilities & & & \\ Wages Payable & Direct Labor + Admin Costs & 15 & 15 \\ Other Accounts Payable & Raw Materials + Sales and Marketing & 45 & 45 \\ \hline \end{tabular} \begin{tabular}{lrrrrrrr} Working Capital (\$ 000) & 2005 & 2006 & 2007 & 2008 & 2009 & 2010 \\ \hline Assets & & & & & & & \\ Accounts Receivable & 18,650 & 21,140 & 23,887 & 26,914 & 30,248 & 33,917 \\ Raw Materials & 1,995 & 2,246 & 2,521 & 2,820 & 3,148 & 3,506 \\ Finished Goods & 4,289 & 4,904 & 5,590 & 6,355 & 7,208 & 8,159 \\ Minimum Cash Balance & 6,217 & 7,047 & 7,962 & 8,971 & 10,083 & 11,306 \\ \cline { 2 - 7 } & 31,151 & 35,337 & 39,960 & 45,060 & 50,687 & 56,888 \\ Total Current Assets & & & & & & \\ Labilities & 1,321 & 1,410 & 1,616 & 1,801 & 2,003 & 2,280 \\ Wages Payable & 3,378 & 3,972 & 4,650 & 5,422 & 6,147 & 6,869 \\ Other Accounts Payable & 4,699 & 5,382 & 6,266 & 7,223 & 8,150 & 9,149 \\ Total Current Liabilities & 26,452 & 29,955 & 33,694 & 37,837 & 42,537 & 47,739 \\ Net Working Capital & & 3,503 & 3,739 & 4,143 & 4,700 & 5,202 \\ Increase in Net Working Capital & & & & & \end{tabular} Fixed Assets and Capital Investment ($000) \begin{tabular}{lcccccc} \hline & 2005 & 2006 & 2007 & 2008 & 2009 & 2010 \\ \hline New Investment & 5,000 & 5,000 & 5,000 & 5,000 & 5,000 & 20,700 \\ Depreciation & (5,540) & (5,486) & (5,437) & (5,394) & (5,354) & (6,889) \\ \hline \end{tabular}


