Question
Forecast Ideko's free cash flow (reproduce Table 19.10 (shown below)), assuming Ideko's market share will increase by 0.55 percent per year; investment, financing, and depreciation
Forecast Ideko's free cash flow (reproduce Table 19.10 (shown below)), assuming Ideko's market share will increase by 0.55 percent per year; investment, financing, and depreciation will be adjusted accordingly; and the projected improvements in working capital (shown below) occur (that is, Ideko's working capital requirements through 2010 will be as shown below). Ideko's pro-forma income statements for 2005-2010 are shown below, while its balance sheet for 2005 is shown below. Ideko's production plant will require an expansion in 2010 (when production volume will exceed the current level by 50%), and the cost of this expansion will be $14.2 million. This amount will be borrowed from a financial institution at an interest rate of 6.9%. The new projected capital investments are shown below.(Assume an income tax rate of 35%.) Calculate Ideko's free cash flow from 2006 through 2010 below:
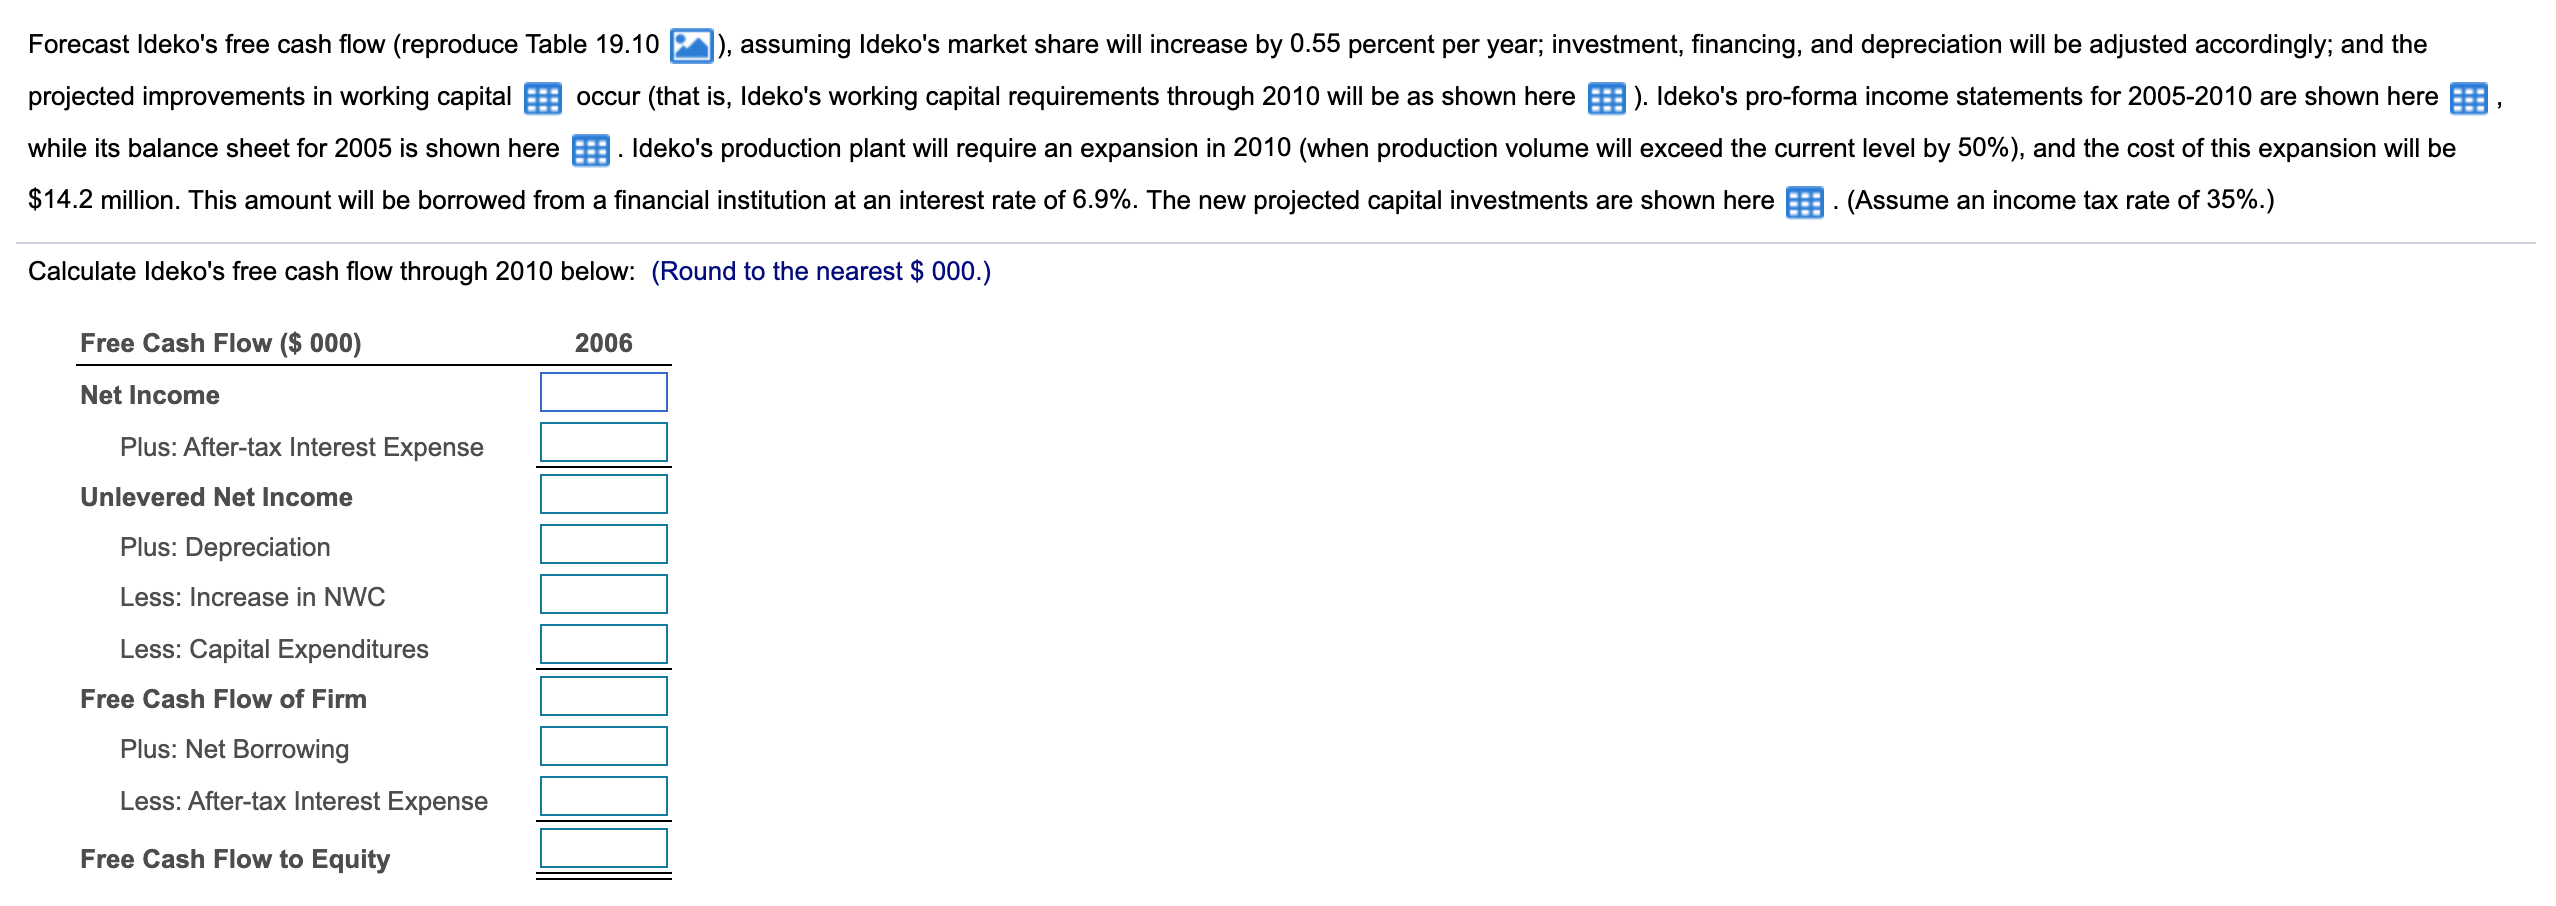
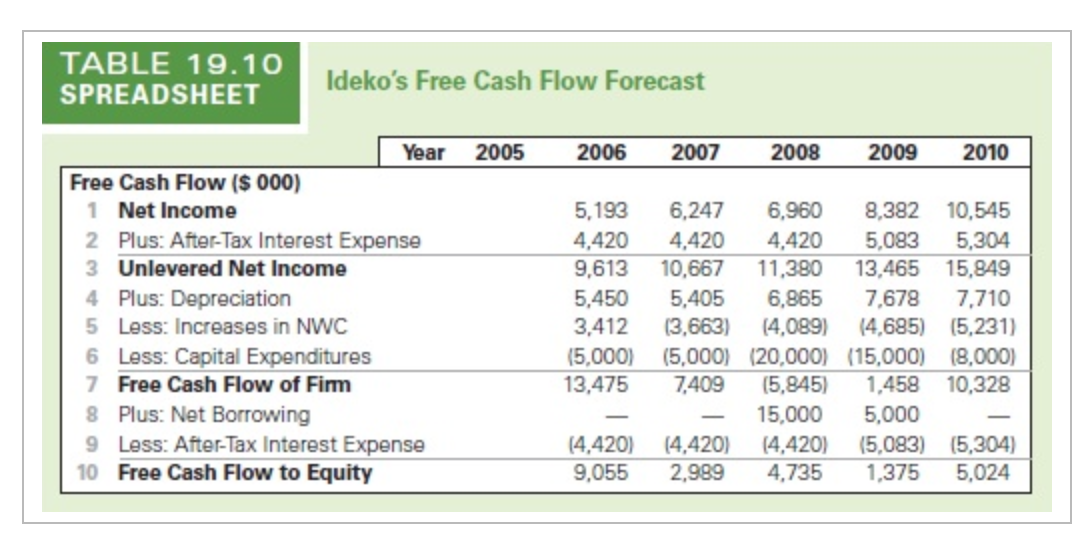
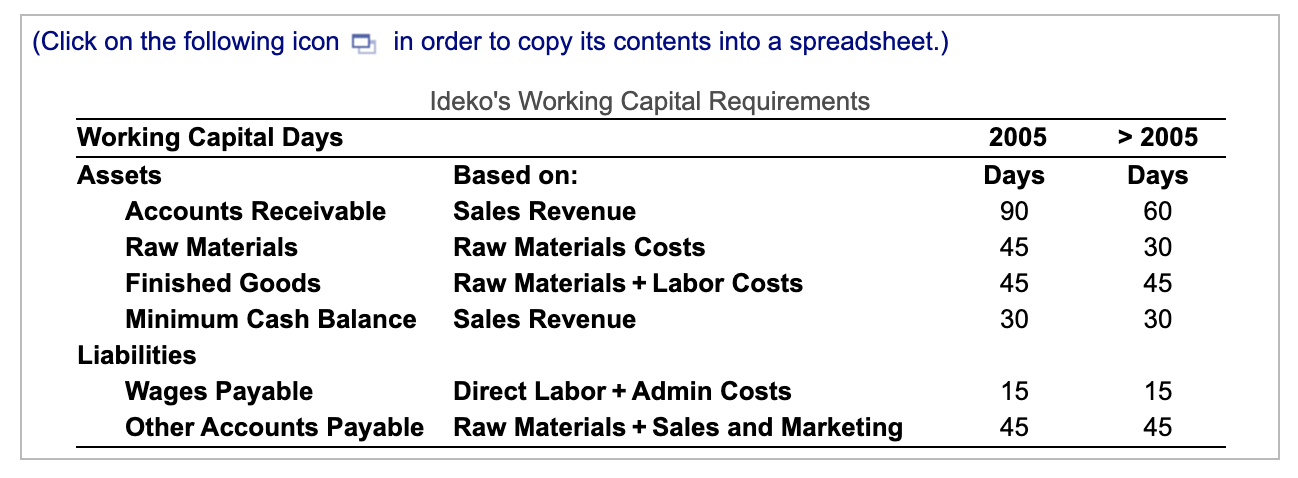
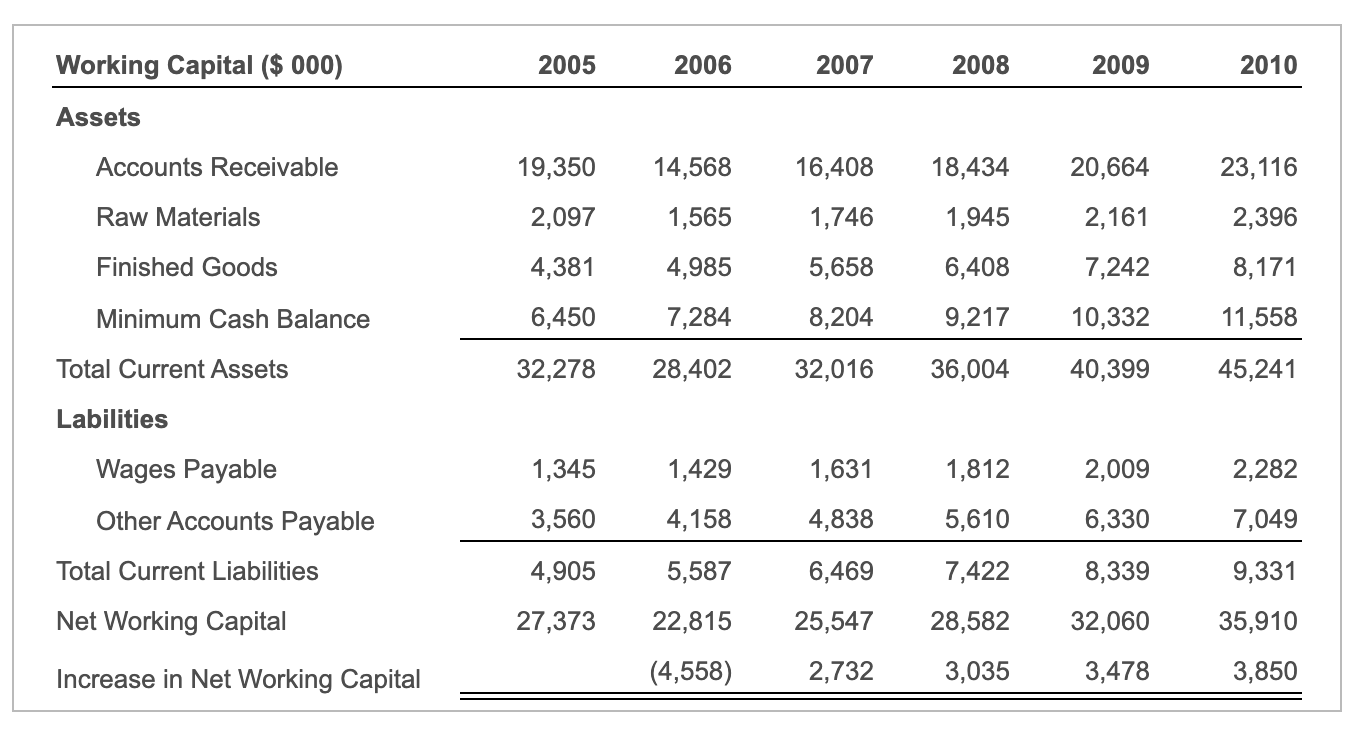
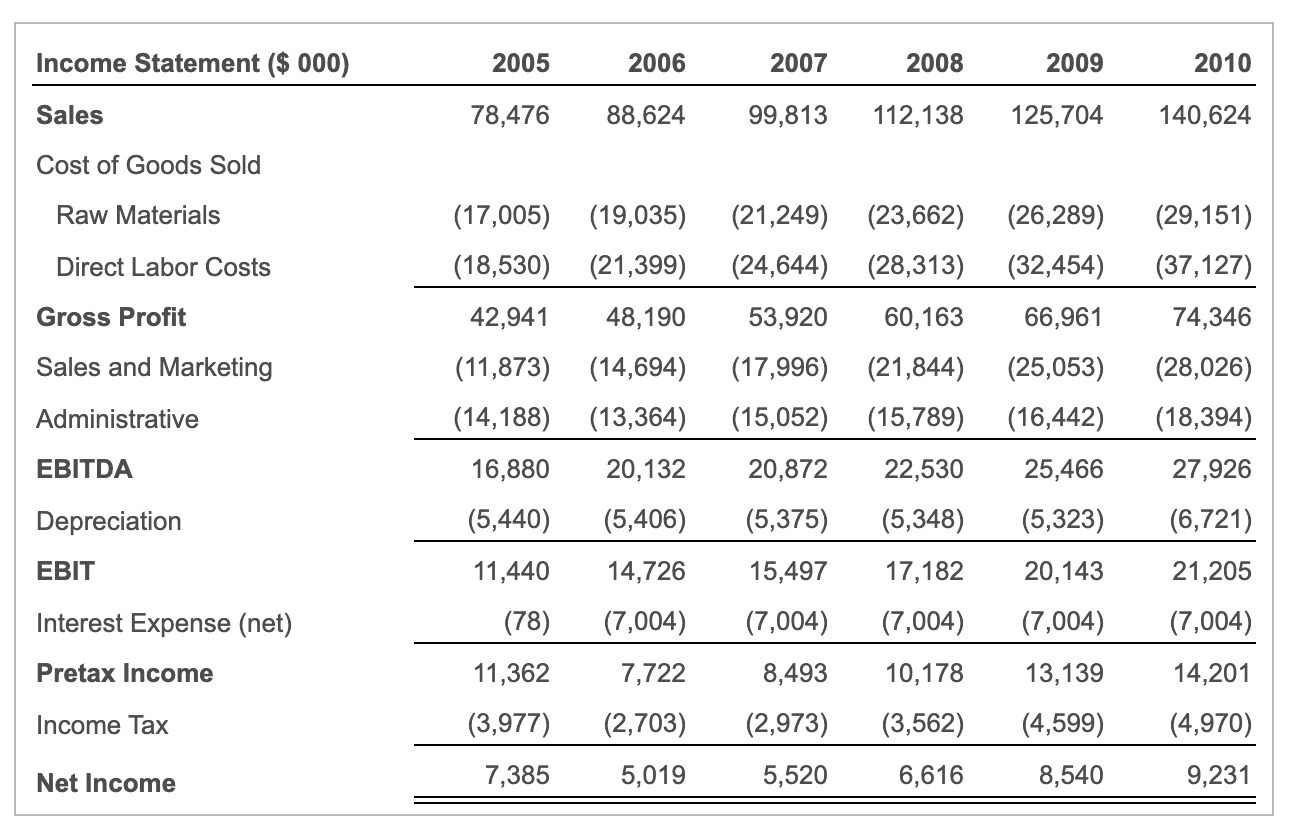
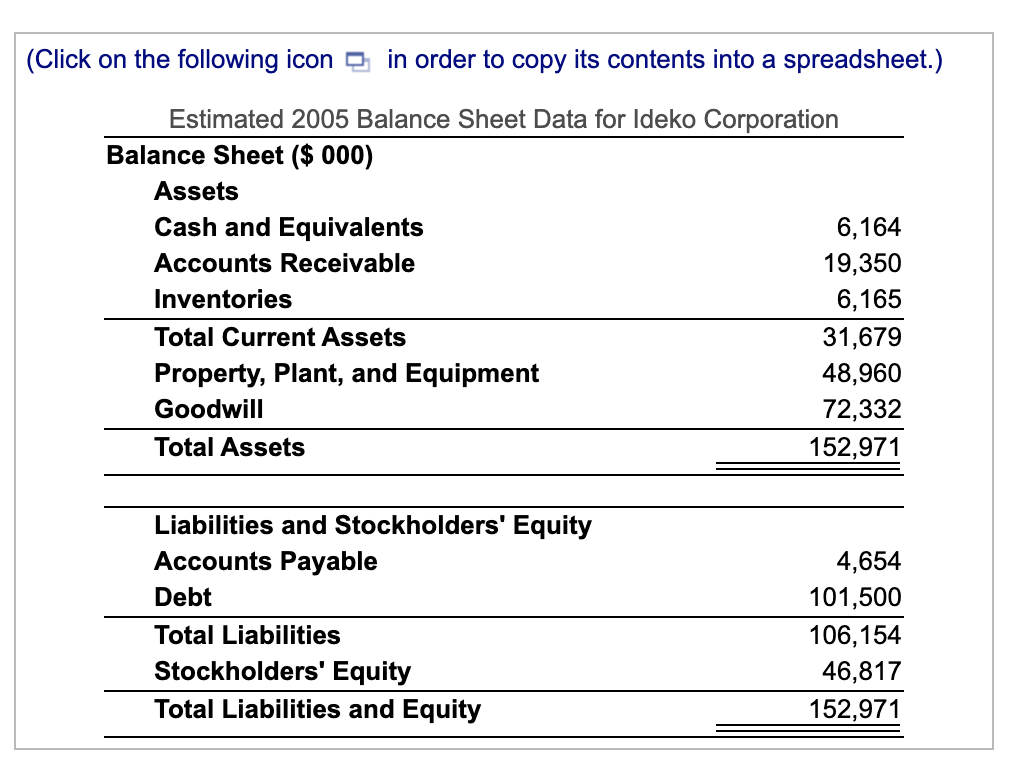

Forecast Ideko's free cash flow (reproduce Table 19.10 ]), assuming Ideko's market share will increase by 0.55 percent per year; investment, financing, and depreciation will be adjusted accordingly; and the projected improvements in working capital e occur (that is, Ideko's working capital requirements through 2010 will be as shown here B). Ideko's pro-forma income statements for 2005-2010 are shown here while its balance sheet for 2005 is shown here . Ideko's production plant will require an expansion in 2010 (when production volume will exceed the current level by 50%), and the cost of this expansion will be $14.2 million. This amount will be borrowed from a financial institution at an interest rate of 6.9%. The new projected capital investments are shown here : - (Assume an income tax rate of 35%.) Calculate Ideko's free cash flow through 2010 below: (Round to the nearest $ 000.) Free Cash Flow ($ 000) 2006 Net Income Plus: After-tax Interest Expense Unlevered Net Income Plus: Depreciation Less: Increase in NWC Less: Capital Expenditures Free Cash Flow of Firm Plus: Net Borrowing Less: After-tax Interest Expense Free Cash Flow to Equity TABLE 19.10 SPREADSHEET Ideko's Free Cash Flow Forecast 2006 2007 2008 2009 2010 Year 2005 Free Cash Flow ($ 000) 1 Net Income 2 Plus: After-Tax Interest Expense 3 Unlevered Net Income 4 Plus: Depreciation 5 Less: Increases in NWC 6 Less: Capital Expenditures 7 Free Cash Flow of Firm 8 Plus: Net Borrowing 9 Less: After-Tax Interest Expense 10 Free Cash Flow to Equity 5,193 4,420 9,613 5,450 3,412 (5,000) 13,475 6,247 6,960 8,382 10,545 4,420 4,420 5,083 5,304 10,667 11,380 13,465 15,849 5,405 6,865 7,678 7,710 (3,663) (4,089) 14.685) (5,231) (5,000) (20,000) (15,000) (8,000) 7,409 (5,845) 1,458 10,328 15,000 5,000 (4,420) (4,420) (5,083) (5,304) 2.989 4,735 1,375 5,024 (4,420) 9,055 (Click on the following icon in order to copy its contents into a spreadsheet.) 2005 Days 90 45 > 2005 Days 60 30 Ideko's Working Capital Requirements Working Capital Days Assets Based on: Accounts Receivable Sales Revenue Raw Materials Raw Materials Costs Finished Goods Raw Materials + Labor Costs Minimum Cash Balance Sales Revenue Liabilities Wages Payable Direct Labor + Admin Costs Other Accounts Payable Raw Materials + Sales and Marketing 45 30 45 30 15 15 45 45 Working Capital ($ 000) 2005 2006 2007 2008 2009 2010 Assets Accounts Receivable 19,350 14,568 16,408 18,434 20,664 23,116 Raw Materials 2,097 1,565 1,746 1,945 2,161 2,396 Finished Goods 4,381 4,985 5,658 6,408 7,242 8,171 6,450 7,284 8,204 9,217 10,332 11,558 Minimum Cash Balance Total Current Assets 32,278 28,402 32,016 36,004 40,399 45,241 Labilities Wages Payable 1,345 1,429 1,631 1,812 2,009 2,282 Other Accounts Payable 3,560 4,158 4,838 5,610 6,330 7,049 Total Current Liabilities 4,905 5,587 6,469 7,422 8,339 9,331 Net Working Capital 27,373 22,815 25,547 28,582 32,060 35,910 Increase in Net Working Capital (4,558) 2,732 3,035 3,478 3,850 Income Statement ($ 000) 2005 2006 2007 2008 2009 2010 Sales 78,476 88,624 99,813 112,138 125,704 140,624 Cost of Goods Sold Raw Materials (23,662) (17,005) (18,530) (19,035) (21,399) (21,249) (24,644) (26,289) (32,454) (29,151) (37,127) Direct Labor Costs (28,313) Gross Profit 42,941 48,190 53,920 60,163 66,961 74,346 Sales and Marketing (11,873) (14,694) (14,188) (13,364) (17,996) (21,844) (15,052) (15,789) (25,053) (16,442) (28,026) (18,394) Administrative EBITDA 16,880 20,132 20,872 22,530 25,466 27,926 Depreciation (5,440) (5,406) (5,375) (5,348) (5,323) (6,721) EBIT 11,440 14,726 15,497 17,182 20,143 21,205 Interest Expense (net) (78) (7,004) (7,004) (7,004) (7,004) (7,004) Pretax Income 11,362 7,722 8,493 10,178 13,139 14,201 Income Tax (3,977) (2,703) (2,973) (3,562) (4,599) (4,970) Net Income 7,385 5,019 5,520 6,616 8,540 9,231 (Click on the following icon in order to copy its contents into a spreadsheet.) Estimated 2005 Balance Sheet Data for Ideko Corporation Balance Sheet ($ 000) Assets Cash and Equivalents 6,164 Accounts Receivable 19,350 Inventories 6,165 Total Current Assets 31,679 Property, Plant, and Equipment 48,960 Goodwill 72,332 Total Assets 152,971 Liabilities and Stockholders' Equity Accounts Payable Debt Total Liabilities Stockholders' Equity Total Liabilities and Equity 4,654 101,500 106,154 46,817 152,971 (Click on the following icon in order to copy its contents into a spreadsheet.) Fixed Assets and Capital Investment ($ 000) 2005 2006 2007 2008 5,100 5,100 5,100 5,100 (5,440) (5,406) (5,375) (5,348) New Investment Depreciation 2009 5,100 (5,323) 2010 19,300 (6,721) Forecast Ideko's free cash flow (reproduce Table 19.10 ]), assuming Ideko's market share will increase by 0.55 percent per year; investment, financing, and depreciation will be adjusted accordingly; and the projected improvements in working capital e occur (that is, Ideko's working capital requirements through 2010 will be as shown here B). Ideko's pro-forma income statements for 2005-2010 are shown here while its balance sheet for 2005 is shown here . Ideko's production plant will require an expansion in 2010 (when production volume will exceed the current level by 50%), and the cost of this expansion will be $14.2 million. This amount will be borrowed from a financial institution at an interest rate of 6.9%. The new projected capital investments are shown here : - (Assume an income tax rate of 35%.) Calculate Ideko's free cash flow through 2010 below: (Round to the nearest $ 000.) Free Cash Flow ($ 000) 2006 Net Income Plus: After-tax Interest Expense Unlevered Net Income Plus: Depreciation Less: Increase in NWC Less: Capital Expenditures Free Cash Flow of Firm Plus: Net Borrowing Less: After-tax Interest Expense Free Cash Flow to Equity TABLE 19.10 SPREADSHEET Ideko's Free Cash Flow Forecast 2006 2007 2008 2009 2010 Year 2005 Free Cash Flow ($ 000) 1 Net Income 2 Plus: After-Tax Interest Expense 3 Unlevered Net Income 4 Plus: Depreciation 5 Less: Increases in NWC 6 Less: Capital Expenditures 7 Free Cash Flow of Firm 8 Plus: Net Borrowing 9 Less: After-Tax Interest Expense 10 Free Cash Flow to Equity 5,193 4,420 9,613 5,450 3,412 (5,000) 13,475 6,247 6,960 8,382 10,545 4,420 4,420 5,083 5,304 10,667 11,380 13,465 15,849 5,405 6,865 7,678 7,710 (3,663) (4,089) 14.685) (5,231) (5,000) (20,000) (15,000) (8,000) 7,409 (5,845) 1,458 10,328 15,000 5,000 (4,420) (4,420) (5,083) (5,304) 2.989 4,735 1,375 5,024 (4,420) 9,055 (Click on the following icon in order to copy its contents into a spreadsheet.) 2005 Days 90 45 > 2005 Days 60 30 Ideko's Working Capital Requirements Working Capital Days Assets Based on: Accounts Receivable Sales Revenue Raw Materials Raw Materials Costs Finished Goods Raw Materials + Labor Costs Minimum Cash Balance Sales Revenue Liabilities Wages Payable Direct Labor + Admin Costs Other Accounts Payable Raw Materials + Sales and Marketing 45 30 45 30 15 15 45 45 Working Capital ($ 000) 2005 2006 2007 2008 2009 2010 Assets Accounts Receivable 19,350 14,568 16,408 18,434 20,664 23,116 Raw Materials 2,097 1,565 1,746 1,945 2,161 2,396 Finished Goods 4,381 4,985 5,658 6,408 7,242 8,171 6,450 7,284 8,204 9,217 10,332 11,558 Minimum Cash Balance Total Current Assets 32,278 28,402 32,016 36,004 40,399 45,241 Labilities Wages Payable 1,345 1,429 1,631 1,812 2,009 2,282 Other Accounts Payable 3,560 4,158 4,838 5,610 6,330 7,049 Total Current Liabilities 4,905 5,587 6,469 7,422 8,339 9,331 Net Working Capital 27,373 22,815 25,547 28,582 32,060 35,910 Increase in Net Working Capital (4,558) 2,732 3,035 3,478 3,850 Income Statement ($ 000) 2005 2006 2007 2008 2009 2010 Sales 78,476 88,624 99,813 112,138 125,704 140,624 Cost of Goods Sold Raw Materials (23,662) (17,005) (18,530) (19,035) (21,399) (21,249) (24,644) (26,289) (32,454) (29,151) (37,127) Direct Labor Costs (28,313) Gross Profit 42,941 48,190 53,920 60,163 66,961 74,346 Sales and Marketing (11,873) (14,694) (14,188) (13,364) (17,996) (21,844) (15,052) (15,789) (25,053) (16,442) (28,026) (18,394) Administrative EBITDA 16,880 20,132 20,872 22,530 25,466 27,926 Depreciation (5,440) (5,406) (5,375) (5,348) (5,323) (6,721) EBIT 11,440 14,726 15,497 17,182 20,143 21,205 Interest Expense (net) (78) (7,004) (7,004) (7,004) (7,004) (7,004) Pretax Income 11,362 7,722 8,493 10,178 13,139 14,201 Income Tax (3,977) (2,703) (2,973) (3,562) (4,599) (4,970) Net Income 7,385 5,019 5,520 6,616 8,540 9,231 (Click on the following icon in order to copy its contents into a spreadsheet.) Estimated 2005 Balance Sheet Data for Ideko Corporation Balance Sheet ($ 000) Assets Cash and Equivalents 6,164 Accounts Receivable 19,350 Inventories 6,165 Total Current Assets 31,679 Property, Plant, and Equipment 48,960 Goodwill 72,332 Total Assets 152,971 Liabilities and Stockholders' Equity Accounts Payable Debt Total Liabilities Stockholders' Equity Total Liabilities and Equity 4,654 101,500 106,154 46,817 152,971 (Click on the following icon in order to copy its contents into a spreadsheet.) Fixed Assets and Capital Investment ($ 000) 2005 2006 2007 2008 5,100 5,100 5,100 5,100 (5,440) (5,406) (5,375) (5,348) New Investment Depreciation 2009 5,100 (5,323) 2010 19,300 (6,721)
Step by Step Solution
There are 3 Steps involved in it
Step: 1

Get Instant Access to Expert-Tailored Solutions
See step-by-step solutions with expert insights and AI powered tools for academic success
Step: 2

Step: 3

Ace Your Homework with AI
Get the answers you need in no time with our AI-driven, step-by-step assistance
Get Started


