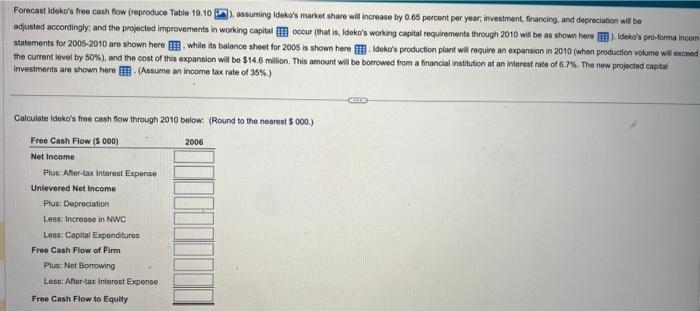
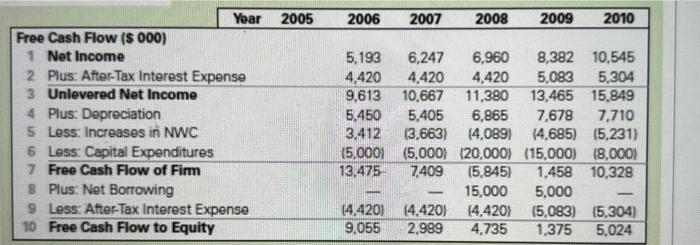
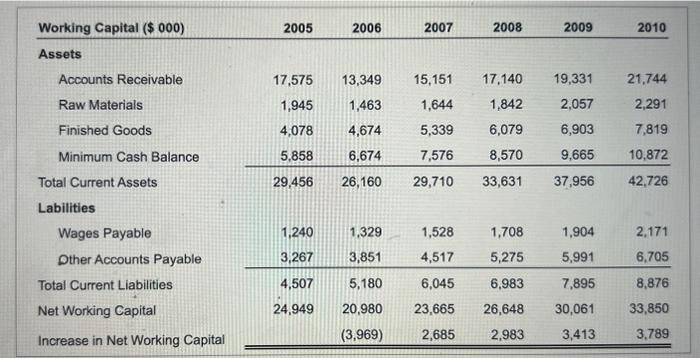
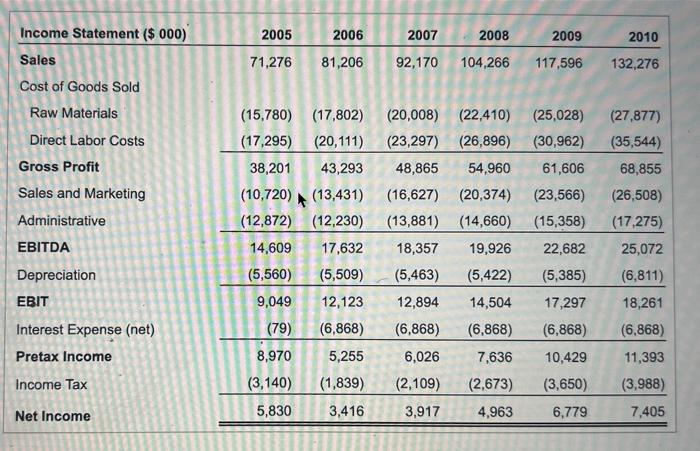
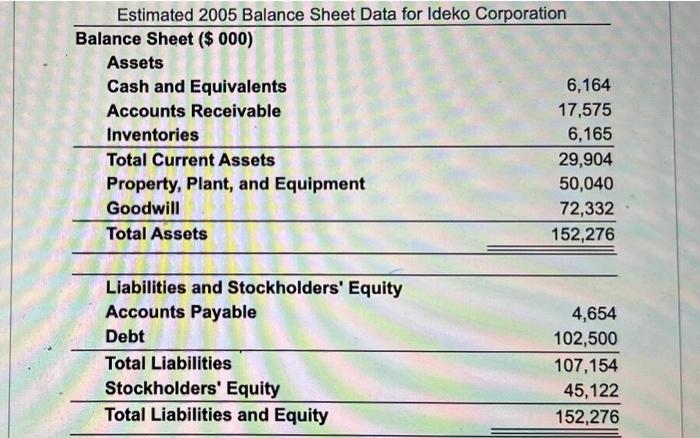
Forecast ldeko's free cash fow (reproduce Table 19.10 C, assuming ldeko's market share will increase by 0.65 percont por year, investrent, financing. and depreciation wir be adjusted accordingly, and the projected improvements in working capital occur (that is, Ideko's working capital requirements through 2010 will be as shown here statements for 2005-2010 are shown here., while its balance sheet for 2005 is shown here. , Ideko's production plant will require an expansion in 2010 (when production volume WWl excee the current level by 50% ), and the cost of this expansion wil bo $14.6 million. This amount will be borrowed from a financial institution at an interest tate of 6.76 . The new projected capitai investments are shown here - (Assume an income tax rate of 35% ) Calculate idekors free cash flow through 2010 below. (Round to the nearest 5000. ) Ideko's Working Capital Requirements \begin{tabular}{llcc} \hline Working Capital Days & & 2005 & >2005 \\ \hline Assets & Based on: & Days & Days \\ Accounts Receivable & Sales Revenue & 90 & 60 \\ Raw Materials & Raw Materials Costs & 45 & 30 \\ Finished Goods & Raw Materials + Labor Costs & 45 & 45 \\ Minimum Cash Balance & Sales Revenue & 30 & 30 \\ Liabilities & & & 15 \\ Wages Payable & Direct Labor + Admin Costs & 15 & 45 \\ Other Accounts Payable & Raw Materials + Sales and Marketing & 45 & 45 \\ \hline \end{tabular} Working Capital ( $000) 2005 2006 2007 2008 2009 2010 Assets \begin{tabular}{lrrrrrr} Income Statement ($000) & 2005 & 2006 & 2007 & 2008 & 2009 & 2010 \\ \hline Sales & 71,276 & 81,206 & 92,170 & 104,266 & 117,596 & 132,276 \\ Cost of Goods Sold & & & & & & \\ Raw Materials & (15,780) & (17,802) & (20,008) & (22,410) & (25,028) & (27,877) \\ Direct Labor Costs & (17,295) & (20,111) & (23,297) & (26,896) & (30,962) & (35,544) \\ \hline Gross Profit & 38,201 & 43,293 & 48,865 & 54,960 & 61,606 & 68,855 \\ Sales and Marketing & (10,720) & (13,431) & (16,627) & (20,374) & (23,566) & (26,508) \\ Administrative & (12,872) & (12,230) & (13,881) & (14,660) & (15,358) & (17,275) \\ EBITDA & 14,609 & 17,632 & 18,357 & 19,926 & 22,682 & 25,072 \\ Depreciation & (5,560) & (5,509) & (5,463) & (5,422) & (5,385) & (6,811) \\ EBIT & 9,049 & 12,123 & 12,894 & 14,504 & 17,297 & 18,261 \\ Interest Expense ( net) & (79) & (6,868) & (6,868) & (6,868) & (6,868) & (6,868) \\ Pretax Income & 8,970 & 5,255 & 6,026 & 7,636 & 10,429 & 11,393 \\ Income Tax & (3,140) & (1,839) & (2,109) & (2,673) & (3,650) & (3,988) \\ \hline Net Income & 5,830 & 3,416 & 3,917 & 4,963 & 6,779 & 7,405 \\ \hline \end{tabular} Estimated 2005 Balance Sheet Data for Ideko Corporation Balance Sheet (\$000) Assets Cash and Equivalents Accounts Receivable \begin{tabular}{lr} Inventories & 6,165 \\ \hline Total Current Assets & 29,904 \\ Property, Plant, and Equipment & 50,040 \\ Goodwill & 72,332 \\ \hline Total Assets & 152,276 \\ \hline \end{tabular} Liabilities and Stockholders' Equity Accounts Payable 4,654 Fixed Assets and Capital Investment ($000) \begin{tabular}{lcccccc} \hline \multicolumn{7}{c}{ Fixed Assets and Capital investment ($000)} \\ \hline & 2005 & 2006 & 2007 & 2008 & 2009 & 2010 \\ \hline New Investment & 5,050 & 5,050 & 5,050 & 5,050 & 5,050 & 19,650 \\ Depreciation & (5,560) & (5,509) & (5,463) & (5,422) & (5,385) & (6,811) \\ \hline \end{tabular} Forecast ldeko's free cash fow (reproduce Table 19.10 C, assuming ldeko's market share will increase by 0.65 percont por year, investrent, financing. and depreciation wir be adjusted accordingly, and the projected improvements in working capital occur (that is, Ideko's working capital requirements through 2010 will be as shown here statements for 2005-2010 are shown here., while its balance sheet for 2005 is shown here. , Ideko's production plant will require an expansion in 2010 (when production volume WWl excee the current level by 50% ), and the cost of this expansion wil bo $14.6 million. This amount will be borrowed from a financial institution at an interest tate of 6.76 . The new projected capitai investments are shown here - (Assume an income tax rate of 35% ) Calculate idekors free cash flow through 2010 below. (Round to the nearest 5000. ) Ideko's Working Capital Requirements \begin{tabular}{llcc} \hline Working Capital Days & & 2005 & >2005 \\ \hline Assets & Based on: & Days & Days \\ Accounts Receivable & Sales Revenue & 90 & 60 \\ Raw Materials & Raw Materials Costs & 45 & 30 \\ Finished Goods & Raw Materials + Labor Costs & 45 & 45 \\ Minimum Cash Balance & Sales Revenue & 30 & 30 \\ Liabilities & & & 15 \\ Wages Payable & Direct Labor + Admin Costs & 15 & 45 \\ Other Accounts Payable & Raw Materials + Sales and Marketing & 45 & 45 \\ \hline \end{tabular} Working Capital ( $000) 2005 2006 2007 2008 2009 2010 Assets \begin{tabular}{lrrrrrr} Income Statement ($000) & 2005 & 2006 & 2007 & 2008 & 2009 & 2010 \\ \hline Sales & 71,276 & 81,206 & 92,170 & 104,266 & 117,596 & 132,276 \\ Cost of Goods Sold & & & & & & \\ Raw Materials & (15,780) & (17,802) & (20,008) & (22,410) & (25,028) & (27,877) \\ Direct Labor Costs & (17,295) & (20,111) & (23,297) & (26,896) & (30,962) & (35,544) \\ \hline Gross Profit & 38,201 & 43,293 & 48,865 & 54,960 & 61,606 & 68,855 \\ Sales and Marketing & (10,720) & (13,431) & (16,627) & (20,374) & (23,566) & (26,508) \\ Administrative & (12,872) & (12,230) & (13,881) & (14,660) & (15,358) & (17,275) \\ EBITDA & 14,609 & 17,632 & 18,357 & 19,926 & 22,682 & 25,072 \\ Depreciation & (5,560) & (5,509) & (5,463) & (5,422) & (5,385) & (6,811) \\ EBIT & 9,049 & 12,123 & 12,894 & 14,504 & 17,297 & 18,261 \\ Interest Expense ( net) & (79) & (6,868) & (6,868) & (6,868) & (6,868) & (6,868) \\ Pretax Income & 8,970 & 5,255 & 6,026 & 7,636 & 10,429 & 11,393 \\ Income Tax & (3,140) & (1,839) & (2,109) & (2,673) & (3,650) & (3,988) \\ \hline Net Income & 5,830 & 3,416 & 3,917 & 4,963 & 6,779 & 7,405 \\ \hline \end{tabular} Estimated 2005 Balance Sheet Data for Ideko Corporation Balance Sheet (\$000) Assets Cash and Equivalents Accounts Receivable \begin{tabular}{lr} Inventories & 6,165 \\ \hline Total Current Assets & 29,904 \\ Property, Plant, and Equipment & 50,040 \\ Goodwill & 72,332 \\ \hline Total Assets & 152,276 \\ \hline \end{tabular} Liabilities and Stockholders' Equity Accounts Payable 4,654 Fixed Assets and Capital Investment ($000) \begin{tabular}{lcccccc} \hline \multicolumn{7}{c}{ Fixed Assets and Capital investment ($000)} \\ \hline & 2005 & 2006 & 2007 & 2008 & 2009 & 2010 \\ \hline New Investment & 5,050 & 5,050 & 5,050 & 5,050 & 5,050 & 19,650 \\ Depreciation & (5,560) & (5,509) & (5,463) & (5,422) & (5,385) & (6,811) \\ \hline \end{tabular}
